The Interview That Humbled a Decade of Experience
Seven years into managing Kubernetes in production, I walked into an interview for a Staff Engineer role at a Bengaluru-based fintech that was running roughly 300 nodes across two AWS regions.
I had personally handled a cluster migration from Flannel to Cilium, debugged etcd compaction issues on a 180-node cluster, and managed rolling deployments for services processing over 2 million API calls per day.
I still stumbled.
The second interviewer asked me to walk through exactly how the Kubernetes scheduler selects a node for a pod. Not just resource availability.
The full thing: the filtering phase, the scoring phase, which default plugins run in which order, how topology spread constraints interact with node affinity when both are defined, and what preemption looks like when no node scores above zero.
I knew the concept. I could not reconstruct the internals cleanly, under time pressure, without my usual context of a terminal and docs open. That specific gap cost me that round.
What I learned is that production experience and structured interview performance are different muscles. One builds intuition through years of incidents.
The other builds the ability to articulate that intuition on demand, in front of someone who is evaluating every hesitation. Both need deliberate practice.
The 30-day plan in this article is what I built after that experience and refined across four more interviews in the following year, including the one that landed my current role.
This is not a certification summary or a list of kubectl commands copied from the docs. It is the actual structure that worked, with the failures included.
Why Kubernetes Interviews Are Harder Than They Look in 2026
The bar has shifted significantly in the last three years. Companies that were hiring engineers who could write a Deployment YAML are now running 50 to 500 node clusters and expecting candidates to reason about the whole system under pressure.
In my experience interviewing at and for companies like Razorpay, Flipkart-scale startups, and global SaaS companies, mid-level and senior Kubernetes interviews now routinely include:
- Live broken-cluster rounds where you are given access and a symptom, no hints
- Scheduler internals: filtering vs scoring phases, plugin order, preemption behavior
- RBAC design from scratch, not just explaining what it is
- Network Policy behavior under different CNI plugins, specifically what breaks when CNI does not enforce policies
- Resource management edge cases: eviction vs OOMKill, CPU throttling vs killing, requests without limits on overcommitted nodes
- StatefulSet guarantees and what actually happens during a rolling update when a pod fails mid-way
The engineers who pass these rounds are not necessarily the ones with the most years of experience.
They are the ones who can reconstruct their understanding precisely and quickly, under observation, without their usual tools. That is what this guide builds.
A Real Production Incident That Became My Best Interview Preparation
Before I describe the 30-day plan, I want to walk through one actual incident from my production work. This is relevant because two of my interview rounds were essentially variations of this exact scenario, and knowing the full arc of a real incident is what made me credible in the room.
The setup: We were running a payment processing service on EKS with 12 replicas. At 2:17 AM, PagerDuty fired. The service had gone from 12 healthy pods to 4 in under three minutes. The other 8 were in CrashLoopBackOff.
Step 1: Read the Signal, Not the Status
My first instinct was to look at the restart count and immediately roll back. I did not. Instead I ran describe on one of the crashing pods:
Command:
kubectl describe pod payment-svc-7d9f4b6c8-xk2mp -n prodThe relevant section of the output looked like this:
kubectl describe output (relevant excerpt):
Last State:     Terminated

  Reason:       OOMKilled

  Exit Code:    137

  Started:      Sat, 18 Apr 2026 02:14:32 +0000

  Finished:     Sat, 18 Apr 2026 02:17:11 +0000

Limits:

  memory: 512Mi

Requests:

  memory: 256Mi

Events:

  Warning  OOMKilling   kubelet  Memory cgroup out of memory: Kill process 14821

  Warning  BackOff      kubelet  Back-off restarting failed container
Exit code 137, OOMKilled in events. That ruled out a code bug, a missing secret, or a probe misconfiguration. Something was consuming more memory than the 512Mi limit allowed.
Step 2: Pull the Previous Logs
The current container had just restarted and had no meaningful output. I pulled the previous run:
Command:
kubectl logs payment-svc-7d9f4b6c8-xk2mp -n prod --previous --tail=50The last lines showed normal request processing up to the moment of the kill. No stack trace, no panic. The runtime was Go, which does not always print a warning before SIGKILL. The log looked like a clean shutdown because the kernel killed the process too fast for it to write anything further.
Step 3: The Wrong Assumption I Almost Made
My first thought was that the memory limit was too low and I should raise it from 512Mi to 768Mi. That would have been a mistake.
I ran kubectl top to check current usage across the surviving pods:
Command:
kubectl top pods -n prod --sort-by=memoryOutput:
NAME                                CPU(cores)   MEMORY(bytes)

payment-svc-7d9f4b6c8-rp9nw         142m         489Mi

payment-svc-7d9f4b6c8-mn3kp         138m         471Mi

payment-svc-7d9f4b6c8-qz7vb         144m         502Mi
The surviving pods were sitting at 471 to 502Mi on a 512Mi limit. They were about to OOMKill too. This was not a limit set too low. Something had changed in the application memory profile.
I checked the Helm release history:
Command:
kubectl rollout history deployment/payment-svc -n prodOutput:
REVISION CHANGE-CAUSE
6         helm upgrade payment-svc v2.4.1

7         helm upgrade payment-svc v2.4.2
Revision 7 had gone out at 01:52 AM, about 25 minutes before the first crash. The change in v2.4.2 turned out to be a new in-memory caching layer that was not bounded. It was accumulating cache entries without eviction. The 512Mi limit was actually correct for v2.4.1. The new code needed either a higher limit or a bounded cache implementation.
The Resolution and What I Took Into Interviews
We rolled back to revision 6 at 2:34 AM. All 12 pods recovered within 4 minutes. The unbounded cache was fixed in v2.4.3 with an explicit eviction policy, and the limit was raised to 768Mi based on profiling under realistic load.
Total incident duration from first alert to full recovery: 17 minutes.
In my experience, most CrashLoopBackOff incidents are resolved within 15 minutes if you follow a consistent sequence: describe to read exit code and events, previous logs to read crash output, kubectl top to check resource state, rollout history to correlate timing, then decide.
The instinct to immediately roll back or immediately raise limits is almost always wrong. Read the signals first.
In two subsequent interviews, I was given a broken cluster with a pod in CrashLoopBackOff and an OOMKilled exit code. Both times, walking the interviewers through this exact sequence, including the wrong assumption I almost made, was what made the difference.
My 30-Day Kubernetes Interview Prep Plan
This plan assumes 1.5 to 2 hours of focused daily study. The hands-on sessions in Weeks 2 and 3 are non-negotiable. Reading without building clusters creates shallow knowledge that collapses under interview pressure.
Week 1: Build an Accurate Mental Model
The first week is not about memorizing commands. It is about building a correct mental model of how Kubernetes works at the component level. If your mental model is wrong, your debugging will always be slow because you will be testing incorrect hypotheses.
Cover these topics in order, spending one full session on each:
- Kubernetes control plane: API server, etcd, controller manager, scheduler, kubelet, kube-proxy. Understand what each owns and what happens if any one of them fails.
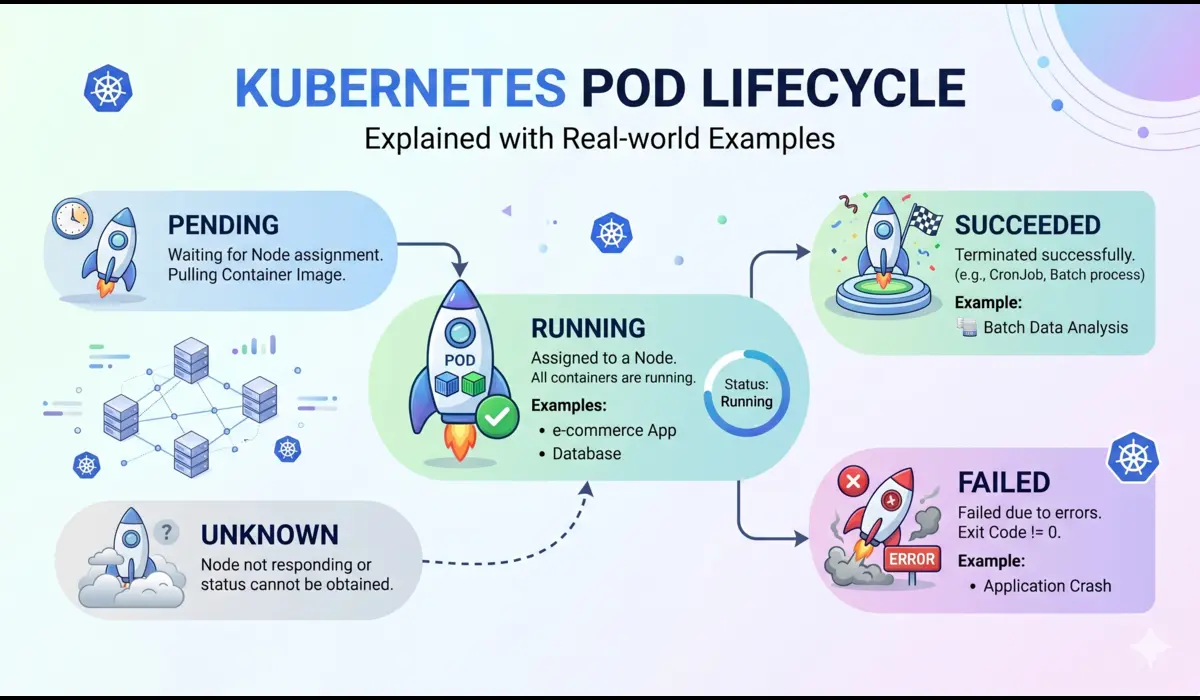
- Pods and their lifecycle. Multi-container pods, init containers, sidecar patterns, ephemeral containers. Understand why pods are the atomic unit of scheduling, not containers.
- ReplicaSets and Deployments. Rolling update mechanics, maxSurge and maxUnavailable, revision history, rollback behavior.
- Services and endpoint slices. How ClusterIP traffic routes through kube-proxy iptables rules. Why an endpoint disappears from a Service when a readiness probe fails.
- ConfigMaps and Secrets. Environment variable injection versus volume mounts. Why volume-mounted Secrets update without a pod restart but environment variables do not.
- Namespaces, resource quotas, and LimitRanges. How these interact with the scheduler.
For Week 1, read the kubernetes.io/docs/concepts section completely. Most candidates skip it and jump to tasks. That is why most candidates cannot explain the control plane clearly under interview pressure.
Pro Tip: Draw the full control plane on paper at the end of Week 1. Trace a kubectl apply request from CLI to running container, naming every component that touches it. When you can do this without looking anything up, your Week 1 mental model is solid enough to build on.
Week 2: Deliberately Break Clusters
Week 2 is where I stopped reading and started deliberately breaking clusters.
Every evening, I spun up a fresh kind cluster and introduced one failure at a time: a bad image tag, a missing secretKeyRef, a failing readiness probe, impossible memory limits.
Then I timed myself diagnosing and fixing it without opening documentation.
The goal was not memorizing kubectl syntax. It was reducing hesitation.
In one mock interview during this period, I lost nearly ten minutes because I checked current logs instead of previous logs on a CrashLoopBackOff container. After repeating that scenario enough times locally, the debugging sequence became automatic: describe pod, previous logs, events, resource usage, rollout history. That speed matters more than theoretical knowledge in live rounds.
Set up your environment before starting:
- Minikube for single-node scenarios. Simple setup, good for beginners.
- kind (Kubernetes in Docker) for multi-node simulations. This is what I used for most of Week 2.
- kubeadm on a cloud VM for the full setup experience. Worth doing at least once before an interview.
Practice these scenarios repeatedly until they require no thought:
- Deploy a Deployment with intentionally wrong image tag, observe ImagePullBackOff, fix it
- Create a Secret with a wrong key name in secretKeyRef. Watch the pod crash. Find the error in previous logs. Correct the key reference.
- Set initialDelaySeconds to 2 on a liveness probe for a service that takes 15 seconds to start. Watch Kubernetes kill it repeatedly. Understand why. Fix the probe timing.
- Set a memory limit of 64Mi on a pod that needs 200Mi. Trigger the OOMKill. Read exit code 137. Increase the limit correctly based on actual usage, not guessing.
- Create an RBAC Role, ServiceAccount, and RoleBinding from scratch. Verify permissions with kubectl auth can-i.
- Write a NetworkPolicy that blocks all ingress to a pod except from a specific namespace. Verify it works.
Pro Tip: The KodeKloud troubleshooting labs forced me to debug broken CoreDNS and RBAC misconfiguration under time pressure. That directly mirrored two interview rounds I later encountered. Their scenario-based labs are worth the subscription specifically for Week 2 and Week 3.
Week 3: Go Deeper on the Topics That Separate Candidates
Week 3 covers the areas that distinguish mid-level from senior candidates in interviews. These are not niche topics. In my experience, they come up in roughly 70 percent of senior Kubernetes interviews at product companies.
- Ingress: path-based and host-based routing, TLS termination with cert-manager, the difference between an Ingress resource and an Ingress controller
- PersistentVolumes: storage classes, access modes, dynamic provisioning, what ReadWriteOnce actually means under node failure
- RBAC: Roles versus ClusterRoles, RoleBindings versus ClusterRoleBindings, service account token projection, RBAC for operator patterns
- Network Policies: default-allow-all behavior, ingress and egress rule structure, the critical CNI compatibility requirement
- HPA: metrics-server dependency, CPU-based scaling behavior, custom metrics via Prometheus Adapter, stabilization windows
- StatefulSets: stable pod identity, ordered deployment and scaling, headless services, what happens when pod-1 fails during a rolling update
- Scheduler internals: filtering phase vs scoring phase, default plugin order, topology spread constraints, preemption mechanics
For mock interviews: find a colleague and run two structured 45-minute sessions per week.
Have them give you a broken YAML and time your diagnosis. The discomfort of being watched while debugging is exactly what the interview replicates. You need to practice under that discomfort.
Tip from myside: Killer.sh is the best Kubernetes practice environment available. Two sessions under real-cluster, timed conditions will make any hands-on interview round feel manageable.
It is included with CKA exam registration. Even if you are not sitting the exam, consider purchasing a standalone session specifically for Week 3 validation.
Week 4: Close Gaps and Tune for the Specific Company
Week 4 is not about learning new material. It is about stress-testing what you already know and tuning it to the company you are interviewing with.
Daily revision routine:
- Trace the control plane flow from memory, out loud. If you hesitate at any component, that is a gap.
- Run every kubectl command from your notes without looking them up. Speed is measured in live rounds.
- Explain one concept out loud as if teaching it to a junior engineer. If you cannot explain it simply, you do not know it well enough yet.
- Read through one real incident or postmortem. Kubernetes incident reports from companies like Cloudflare, Shopify, or GitHub are publicly available and excellent preparation.
For company-specific preparation, search for the company’s engineering blog. If they write about Istio, spend a session on service mesh basics.
If they run EKS at scale, understand IAM roles for service accounts, managed node groups, and the AWS Load Balancer Controller.
LinkedIn job descriptions often name the exact tools the team uses. GitHub repositories sometimes contain the actual Helm charts they run in production.
Must-Know kubectl Commands for Kubernetes Interviews
These are not commands to memorize for their own sake. They are the tools interviewers watch you reach for. In live rounds, the sequence you use reveals your debugging methodology, and methodology is what senior interviewers are actually evaluating.
1. Read Events and Exit Codes Before Anything Else
Command:
kubectl describe pod <pod-name> -n <namespace>
In the output, focus on three sections: Last State (exit code of the previous run), Events (probe failures, OOMKills, image pull errors), and Limits/Requests (memory pressure context). Exit code 137 means the kernel killed the process, either OOM or external SIGKILL. Exit code 1 is an application crash. Exit code 127 is a missing binary in the container, almost always a Dockerfile CMD issue.
2. Get the Previous Container Logs After a Crash
Commands:
kubectl logs <pod-name> -n <namespace> --previous

kubectl logs <pod-name> -n <namespace> --previous --tail=100
This is the step most engineers skip. When a pod is in CrashLoopBackOff, the current container has just restarted and may have no output yet. T
he crash evidence is in the previous run. In my experience, the root cause appears in the last 10 to 20 lines of the previous log in the majority of incidents.
3. Check Live Resource Consumption
Commands:
kubectl top pods -n <namespace> --sort-by=memory

kubectl top nodes
Requires metrics-server running in the cluster. If it is not installed, interviewers sometimes ask you to install it as part of the round. Know the install command: kubectl apply -f https://github.com/kubernetes-sigs/metrics-server/releases/latest/download/components.yaml
4. Decode a Secret to Verify Its Value
Command:
kubectl get secret <name> -n <namespace> \

  -o jsonpath='{.data.<key>}' | base64 -d
Secrets are base64-encoded, not encrypted. A wrong key name in secretKeyRef causes a pod to fail without a clear error in the application log. Decoding the Secret manually confirms whether the value is correct and whether the key name matches what the pod manifest references.
5. Correlate Restart Timing with Deployment History
Commands:
kubectl rollout history deployment/<name> -n <namespace>

kubectl rollout undo deployment/<name> -n <namespace>

kubectl rollout undo deployment/<name> --to-revision=3 -n <namespace>
In the incident walkthrough earlier, correlating restart timestamps with the Helm release history in under two minutes identified the root cause. This sequence: describe to get the crash time, rollout history to find what changed around that time, is the fastest path to a deployment-caused CrashLoopBackOff.
6. Force a Rolling Restart to Pick Up Config Changes
Command:
kubectl rollout restart deployment/<name> -n <namespace>Environment variables injected from ConfigMaps or Secrets do not update in running containers when the underlying resource changes. This command triggers a rolling restart that picks up the new values. Interviewers ask about this pattern frequently because many engineers do not know it exists and instead delete pods manually.
7. Verify RBAC Permissions for a Service Account
Command:
kubectl auth can-i list pods \

  --as=system:serviceaccount:<namespace>:<sa-name> -n <namespace>
In one interview, the broken cluster scenario involved a pod that was crashing because its application was trying to list ConfigMaps in another namespace and being denied by RBAC.
kubectl auth can-i confirmed the denial in seconds. Without that command, I would have spent significant time reading application logs trying to understand a permission error.
8. Add an Ephemeral Debug Container Without Restarting the Pod
Command:
kubectl debug -it <pod-name> \

  --image=busybox --target=<container-name> -n <namespace>
For intermittent crashes where you need to inspect the filesystem, network connectivity, or environment at runtime without losing the running state. The ephemeral container shares the process namespace with the target container.
9. Watch Events for a Specific Pod in Real Time
Command:
kubectl get events -n <namespace> --watch \

  --field-selector involvedObject.name=<pod-name>
Run this in one terminal pane while applying fixes in another. Probe failures, scheduling decisions, and image pull errors appear in real time. This is how I confirmed recovery in the 2 AM incident: watching events flip from OOMKilling to Running without switching contexts repeatedly.
10. Force Delete a Stuck Pod
Command:
kubectl delete pod <pod-name> -n <namespace> --force --grace-period=0Watch Out: This bypasses graceful shutdown completely. In-flight requests are dropped. The kubelet does not wait for the container process to exit cleanly. Use only when the pod is stuck in Terminating and you have confirmed there is no risk to ongoing requests. Interviewers ask why this is dangerous, so know the answer before using it.
Pro Tip: In any live debugging round, narrate your reasoning out loud: ‘I am reading describe first because exit code 137 would mean OOM and change my entire next step.’ Interviewers hire engineers they can trust to think clearly during incidents. The narration demonstrates that thinking.
Technical Depth: Three Areas Where Most Candidates Stop Too Early
These are the topics where I see experienced candidates give correct but shallow answers. At the senior level, shallow answers on these topics cost rounds.
The Kubernetes Scheduler: More Than Resource Availability
Most candidates describe the scheduler as something that finds a node with enough CPU and memory. That is the filtering phase.
There is also a scoring phase, and the distinction matters in interviews.
The filtering phase eliminates nodes that cannot run the pod: insufficient resources, node selectors not matching, taints without matching tolerations, pod anti-affinity conflicts.
If no nodes pass filtering, the pod stays Pending and you see an event saying no nodes are available with enough memory or no nodes match the required affinity.
The scoring phase ranks the remaining nodes using plugins.
The default plugins include LeastAllocated (prefer nodes using fewer resources), BalancedAllocation (prefer nodes where CPU and memory usage are proportional), and NodeAffinity (prefer nodes that match preferred affinity terms).
Each plugin produces a score from 0 to 100, and the weights are summed to produce a final node ranking.
Topology spread constraints add another layer. If you define a constraint that requires pods to be spread across availability zones with a maxSkew of 1, the scheduler will not place a pod on a zone that already has more pods than others by more than one, even if that zone has plenty of available resources.
This is a common source of Pending pods in production clusters that are not obviously under-resourced.
Preemption happens when a high-priority pod cannot be scheduled because all nodes fail filtering. The scheduler identifies lower-priority pods it can evict to make room and evicts them.
This is why a critical service can displace a batch job mid-run. Understanding this behavior is important when PriorityClasses are involved.
Secrets: What Base64 Actually Means for Security
The common interview answer is ‘Secrets are base64-encoded, not encrypted.’ That is true but incomplete at the senior level.
By default, Secret values are stored in etcd as base64-encoded plaintext. Anyone with direct etcd access, which includes anyone with the right kubeconfig or access to the etcd endpoint, can read every Secret in the cluster. The encoding is purely for transport, not protection.
Encryption at rest requires explicitly configuring an EncryptionConfiguration resource and restarting the API server with the –encryption-provider-config flag.
The most common providers are secretbox (fast, AES-CBC-based) and kms (delegates to an external KMS like AWS KMS or HashiCorp Vault). On EKS, envelope encryption uses an AWS KMS key and is a one-click configuration option that is off by default.
There is also a delivery risk. Secrets injected as environment variables are visible in pod specs, potentially exposed in CI logs, and cannot be rotated without a pod restart.
Secrets mounted as volumes can be updated in place by kubelet when the Secret changes (with a short propagation delay).
The more secure pattern for production is the Secrets Store CSI driver with an external secret manager, which keeps the secret value entirely outside Kubernetes and injects it directly into the pod filesystem at runtime.
RBAC: The Full Binding Flow
The common answer covers Roles, ClusterRoles, RoleBindings, and ClusterRoleBindings. The part that comes up in senior interviews is the service account token flow and how RBAC failures actually manifest.
When a pod is created with a serviceAccountName, kubelet mounts a projected service account token into the pod at /var/run/secrets/kubernetes.io/serviceaccount/token.
This token is a short-lived JWT (default expiry 1 hour, rotated automatically by the token controller) signed by the API server’s service account key.
When the application calls the Kubernetes API, it presents this token. The API server validates the signature, extracts the service account identity, and checks the RBAC bindings.
RBAC failures produce a 403 Forbidden response from the API server. The error appears in the application log as a permission denied or forbidden error. kubectl auth can-i is the fastest way to reproduce the exact permission check: it simulates the request as the service account identity and returns allowed or not.
A common production mistake is using ClusterRoleBindings when RoleBindings would be sufficient. A ClusterRoleBinding grants cluster-wide permissions.
If the intent is to grant a pod access to ConfigMaps only in its own namespace, a RoleBinding scoped to that namespace is the correct choice. Using ClusterRoleBinding for that same Role grants the service account access to ConfigMaps in every namespace in the cluster.
Questions I Was Actually Asked in My Interviews
These are real questions from interviews at Indian product companies and global SaaS companies, with the answers I gave or refined based on the feedback I received.
Q1: Walk me through what happens after kubectl apply -f deployment.yaml
kubectl authenticates and sends the request to the API server. The API server validates the object schema and authorization, then writes it to etcd.
The Deployment controller inside the controller manager detects the new Deployment via a watch and creates a ReplicaSet.
The ReplicaSet controller creates Pod objects in the desired count. The scheduler watches for unscheduled pods, runs the filtering and scoring phases, and assigns each pod to a node.
The kubelet on each selected node receives the assignment, pulls the container image, creates the container, and starts executing the readiness probe.
When the readiness probe passes, the endpoint controller adds the pod’s IP to the EndpointSlice for the matching Service. kube-proxy on every node updates its iptables rules to route traffic to the new endpoint.
Q2: A pod is in CrashLoopBackOff. What is your exact debugging sequence?
In my experience, this is the sequence that resolves the majority of CrashLoopBackOff incidents: kubectl describe to read the exit code and events.
Exit code 137 means OOM, exit code 1 means app crash, exit code 127 means missing binary. Then kubectl logs with the previous flag to read the actual crash output.
Then kubectl top to check whether surviving pods are also under memory pressure. Then rollout history to correlate crash timing with recent deployments. At that point you almost always know the cause. Only then do you decide whether to roll back, fix configuration, or increase resource limits.
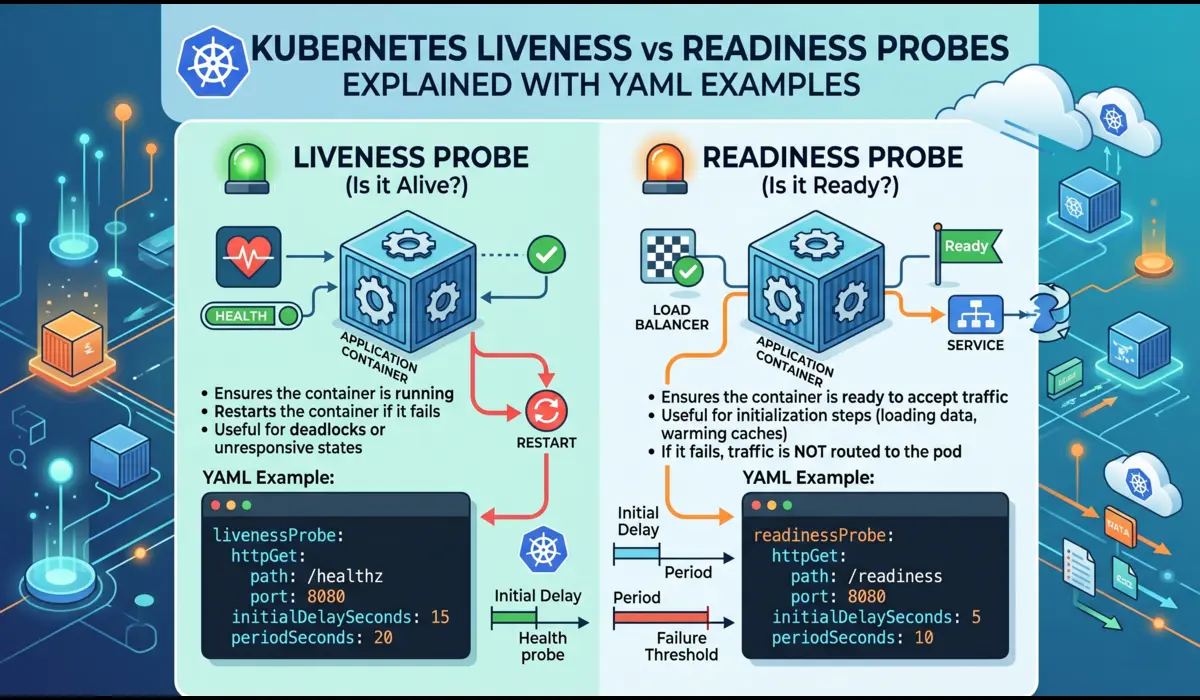
Q3: What is the difference between liveness and readiness probes, and what is startupProbe?
A liveness probe answers whether the container process is still alive. If it fails consistently, Kubernetes kills and restarts the container.
A readiness probe answers whether the container is ready to serve traffic. If it fails, the pod is removed from Service endpoints but not restarted.
A startupProbe is designed specifically for applications with slow or variable initialization times. It runs first, and neither the liveness nor readiness probe runs until the startupProbe passes.
This prevents the liveness probe from killing a container that is legitimately still starting up. JVM applications and anything that runs database migrations on startup are good candidates for startupProbe.
Q4: Why does Flannel not enforce NetworkPolicies?
NetworkPolicy is a Kubernetes API object, but enforcement is delegated entirely to the CNI plugin. Kubernetes itself does not enforce network rules. Flannel is a simple overlay network that focuses on connectivity, not policy enforcement.
It does not read NetworkPolicy objects and does not install any iptables rules based on them. If you apply a NetworkPolicy on a cluster running only Flannel, the object is accepted by the API server but has no effect on actual traffic.
Calico, Cilium, and Weave Net all implement NetworkPolicy enforcement. Cilium goes further and supports L7 policies (HTTP method and path-level filtering) using eBPF.
Q5: What is the difference between eviction and OOMKill?
This is a question most mid-level candidates cannot answer clearly. An OOMKill happens at the container level: the Linux kernel kills a specific process because it exceeded the cgroup memory limit set by the container runtime. The kubelet sees the exit code 137 and marks the container as OOMKilled.
An eviction happens at the pod level: the kubelet itself decides to remove a pod from the node because the node is under memory or disk pressure, before any individual container hits its cgroup limit.
Eviction is a node-health mechanism. OOMKill is a container-limit enforcement mechanism. A pod can be evicted even if all its containers are within their individual limits, simply because the node is running out of memory globally.
Q6: How does CPU throttling differ from memory limits?
Memory limits are enforced by killing the container when it exceeds the cgroup limit. CPU limits are enforced by throttling: the container runtime restricts the container to its CPU quota and prevents it from using more CPU cycles in each scheduling period, even if the node has idle CPU capacity.
The container continues running but runs slower. CPU throttling is silent and does not appear in pod events or logs.
The only way to observe it is through metrics: container_cpu_throttled_seconds_total in Prometheus or the equivalent in your monitoring stack. High CPU throttling under load is a common cause of latency issues that look like application problems but are actually resource constraint problems.
Q7: How would you design zero-downtime deployments for a stateless API service?
Set the Deployment strategy to RollingUpdate with maxUnavailable 0 and maxSurge 1. Configure a readiness probe that actually reflects the service’s ability to handle traffic, not just that the process started.
Set terminationGracePeriodSeconds to cover the maximum time an in-flight request might take to complete. Add a preStop lifecycle hook with a short sleep, typically 5 to 15 seconds, to allow the load balancer time to stop routing new requests before the container begins shutting down.
For services with database schema dependencies, run backward-compatible migrations as a separate step before the application deployment, so both old and new application versions can read the schema simultaneously during the rollout.
Q8: A node shows NotReady. What is your investigation sequence?
kubectl describe node to read the Conditions section: MemoryPressure, DiskPressure, PIDPressure, Ready. If any non-Ready conditions are present, the kubelet is reporting the specific problem.
Then SSH to the node and check: systemctl status kubelet for kubelet health, journalctl -u kubelet -n 100 for recent log output, df -h for disk usage, and free -h for memory.
In my experience, the most common causes are a full disk (container image layers or log accumulation), a crashed kubelet (usually from a failed API server certificate rotation), and a container runtime issue (containerd or Docker daemon crash).
If the kubelet is healthy but the node is still NotReady, check network connectivity between the node and the API server.
Q9: Explain what happens when a StatefulSet pod fails during a rolling update
StatefulSet rolling updates proceed in reverse ordinal order: pod-N is updated first, then pod-N-1, then pod-2, then pod-1, then pod-0.
Before updating the next pod, the StatefulSet controller waits for the current pod to be Running and Ready. If the updated pod fails its readiness probe and does not become Ready within the deadline, the rollout blocks.
The StatefulSet does not continue updating the remaining pods, and it does not automatically roll back. You are left with some pods on the new version and some on the old version.
This is intentional: for stateful applications, partial updates are often safer than automatic rollbacks that could cause data consistency issues. You need to intervene manually to either fix the failing pod or roll back the StatefulSet explicitly.
Q10: How do you debug DNS resolution failures inside a pod?
Start with a debug container in the affected pod’s namespace: kubectl run dns-debug –image=busybox:1.28 –rm -it –restart=Never — nslookup kubernetes.default.
If that fails, DNS is broken at the cluster level. Check CoreDNS pod health in the kube-system namespace. If CoreDNS pods are running, check their logs for upstream resolution failures.
Verify the CoreDNS ConfigMap in kube-system to confirm the forward directive is pointing to the correct upstream resolver.
If the debug container resolves kubernetes.default but the application pod cannot resolve service names, the issue is often that the pod’s /etc/resolv.conf has incorrect search domains or nameserver entries, which can happen when node DNS is misconfigured and dnsPolicy is set to ClusterFirst without the right node configuration.
YAML Examples That Come Up in Interviews
Interviewers frequently ask candidates to write these from scratch. Practice until they require no reference.
Probe Configuration: The Right Way for JVM Applications
A liveness probe that kills a JVM service before it finishes starting is one of the most common production misconfigurations I have seen. The correct pattern:
YAML:
startupProbe:

  httpGet:

    path: /healthz

    port: 8080

  failureThreshold: 30

  periodSeconds: 5

livenessProbe:

  httpGet:

    path: /healthz

    port: 8080

  initialDelaySeconds: 0

  periodSeconds: 15

  failureThreshold: 3

  timeoutSeconds: 5

readinessProbe:

  httpGet:

    path: /ready

    port: 8080

  initialDelaySeconds: 0

  periodSeconds: 10

  failureThreshold: 3
The startupProbe gives the JVM up to 150 seconds (30 failures x 5 second period) to start. Once it passes, the liveness probe takes over with a 15-second period.
The readiness probe uses a separate /ready endpoint that checks database connectivity, cache warmup, or any other application-specific readiness condition.
RBAC Role and Binding for a Pod Reading ConfigMaps
YAML:
apiVersion: rbac.authorization.k8s.io/v1

kind: Role

metadata:

  name: configmap-reader

  namespace: production

rules:

- apiGroups: [""]

  resources: ["configmaps"]

  verbs: ["get", "list", "watch"]

---

apiVersion: rbac.authorization.k8s.io/v1

kind: RoleBinding

metadata:

  name: configmap-reader-binding

  namespace: production

subjects:

- kind: ServiceAccount

  name: payment-svc

  namespace: production

roleRef:

  kind: Role

  name: configmap-reader

  apiGroup: rbac.authorization.k8s.io
Note this uses a Role and RoleBinding scoped to the production namespace, not a ClusterRole and ClusterRoleBinding. The pod can only read ConfigMaps in its own namespace, which is the principle of least privilege.
Zero-Downtime Deployment Strategy
YAML:
strategy:

  type: RollingUpdate

  rollingUpdate:

    maxUnavailable: 0

    maxSurge: 1

template:

  spec:

    terminationGracePeriodSeconds: 60

    containers:

    - name: payment-svc

      lifecycle:

        preStop:

          exec:

            command: ["/bin/sh", "-c", "sleep 10"]

      readinessProbe:

        httpGet:

          path: /ready

          port: 8080

        periodSeconds: 5

        failureThreshold: 2
Common Mistakes Candidates Make
- The current container after a CrashLoopBackOff restart often has no output. The crash evidence is in the previous run. Always use the previous flag first.Reading current logs instead of previous logs.
- This destroys the previous container logs and the full event history tied to that pod UID. Read everything before deleting anything.Deleting the crashing pod immediately.
- They are not, by default. Saying this in an interview at a company that takes security seriously will end the conversation. Secrets are base64-encoded and stored in etcd as plaintext unless encryption at rest is explicitly configured.Saying ‘Secrets are encrypted in Kubernetes.’
- These are different mechanisms at different levels. Eviction is the kubelet removing a pod to protect node health. OOMKill is the kernel enforcing a container’s cgroup memory limit. Senior interviewers test this distinction specifically.Confusing eviction with OOMKill.
- This comes up constantly and many candidates who have used Flannel in production cannot explain it. The answer is that Flannel does not implement the NetworkPolicy enforcement API. The CNI plugin is responsible, and Flannel does not include that responsibility.Not knowing why Flannel does not enforce NetworkPolicies.
- They serve different purposes. A temporary upstream dependency failure should make a pod not-ready (remove it from load balancing) but not kill it. Using the same endpoint for both causes unnecessary restarts.Using the same probe endpoint for liveness and readiness.
What I Learned the Hard Way
I failed a debugging round once because I spent the first eight minutes checking current pod logs, kubectl get deployment, and kubectl describe service before running kubectl logs with the previous flag.
By the time I found the error, the interviewer had already formed an impression of my debugging methodology. I passed that round, but narrowly.
The lesson was not to memorize the right commands. It was to always start with the exit code.
I misunderstood StatefulSet rolling update behavior until an interviewer caught me. I said StatefulSet rollouts auto-roll back on failure, the same way Deployments do. That is wrong. StatefulSets block and wait for manual intervention.
That single gap cost me significant credibility in that round. I spent two hours after that interview reading the StatefulSet documentation end to end.
I also learned to be precise about what I do not know. In one interview, I was asked about scheduler preemption behavior with custom priority classes and multiple competing pods.
I knew the general concept but not the precise ordering algorithm. I said: ‘I know preemption occurs when high-priority pods cannot be scheduled and the scheduler identifies lower-priority pods to evict, but I am not confident in the exact ordering algorithm when multiple preemption candidates exist across nodes.
I would verify that in the documentation before making a production decision.’ The interviewer told me afterward that was the answer that made him want to hire me. Knowing your own limits precisely is a senior engineering skill.
- The most authoritative source. Read the entire Concepts section in Week 1. Most candidates skip this. It is the reason most candidates cannot explain the control plane under pressure.
- The best free video series for visual learners. Her Kubernetes Tutorial for Beginners playlist covers architecture and core concepts with clear diagrams. I rewatched the scheduler and networking videos three times during Week 3.
- The troubleshooting labs are scenario-based and timed. The CoreDNS and RBAC debugging labs directly mirrored two interview rounds I encountered. Worth the subscription specifically for Weeks 2 and 3.
- The most realistic practice environment available. Two full sessions under real-cluster, timed conditions. Nothing I used built interview speed faster than this. Comes with CKA registration, also available standalone.
- For senior roles, reading KEPs for features you mention (like topology spread constraints or the scheduler framework) signals genuine depth. Interviewers who write Kubernetes tools notice.Kubernetes Enhancement Proposals (KEPs) on GitHub
- The production debugging methodology I walked through in the incident section of this article is covered in detail here.
- If Week 1 concepts feel unfamiliar, start here before attempting this guide.
Quick Reference: kubectl Commands for Interview Rounds
| Command | When to Use |
|---|---|
| kubectl describe pod <name> -n <ns> | First step in any debug session. Read exit code and events. |
| kubectl logs <name> -n <ns> –previous –tail=100 | Get crash output from the previous container run. |
| kubectl top pods -n <ns> –sort-by=memory | Check live CPU and memory usage across pods. |
| kubectl rollout history deployment/<name> -n <ns> | Correlate crash timing with recent deployments. |
| kubectl rollout undo deployment/<name> -n <ns> | Roll back to the previous revision. |
| kubectl rollout restart deployment/<name> -n <ns> | Force rolling restart to pick up updated ConfigMap or Secret. |
| kubectl auth can-i list pods –as=system:serviceaccount:<ns>:<sa> | Verify RBAC permissions for a service account. |
| kubectl debug -it <pod> –image=busybox –target=<c> | Attach ephemeral debug container without restarting pod. |
| kubectl get events -n <ns> –watch –field-selector involvedObject.name=<pod> | Watch real-time events for a specific object. |
| kubectl get secret <name> -o jsonpath='{.data.<key>}’ | base64 -d | Decode a Secret value to verify its contents. |
FAQ
How long does it realistically take to prepare for a senior Kubernetes interview?
For someone with 2 to 4 years of DevOps experience and moderate Kubernetes exposure, 30 days at 1.5 hours per day is achievable for mid-level roles. Senior roles with live debugging rounds and deep-architecture questions typically require 45 to 60 days. More years of experience speeds up concept absorption but does not eliminate the need to practice command-line speed under observation.
Do I need the CKA certification to get a senior Kubernetes role?
No. The CKA is a useful credibility signal and the preparation process builds genuine skill because the exam is hands-on in a real cluster. But several companies I interviewed at did not ask about certification at all. What they tested was live debugging ability and the ability to explain trade-offs. Preparing for the CKA is one of the best ways to build those skills, even if you never sit the exam.
What is the best free resource for Kubernetes interview prep in 2026?
The official Kubernetes documentation at kubernetes.io/docs/concepts and TechWorld with Nana’s YouTube channel are both free and substantively useful. For hands-on practice, kind on your own machine with intentionally broken scenarios is free and more effective than any paid tutorial for building debugging instinct.
How do Kubernetes interviews at Indian product companies differ from global SaaS companies?
In my experience, Indian product companies like Razorpay focus heavily on production debugging scenarios and incident response methodology. They want to know how you handle things when they break. Global SaaS companies at senior levels tend to go deeper on architecture design, multi-cluster strategies, and platform engineering. The kubectl command knowledge is table stakes at both. The differentiation happens at the level of systems thinking and trade-off articulation.
What kubectl commands come up most in hands-on interview rounds?
Based on my experience across multiple rounds: kubectl describe (exit codes and events), kubectl logs with the previous flag (crash analysis), kubectl rollout history and undo (deployment correlation and rollback), kubectl auth can-i (RBAC verification), and kubectl top (resource state). These five sequences appear in the large majority of hands-on rounds I have seen or participated in.
How do I practice Kubernetes debugging without access to a production cluster?
kind on your laptop gives you a multi-node cluster for free. The practice is: introduce one specific failure, time yourself diagnosing it, fix it, reset, repeat. The failures that matter most to practice: wrong image tag, bad secretKeyRef key name, liveness probe killing a slow-starting container, OOM limit set too low, RBAC permission denied, and NetworkPolicy blocking expected traffic. Each of these has a distinct signal. Drilling them until the signal recognition is automatic is what makes live interview rounds feel manageable.
What 30 Days Actually Gets You
Kubernetes interviews test whether you can think clearly about a distributed system under pressure and communicate that thinking to someone who is evaluating your judgment. The production experience you already have is the foundation. This plan is about building the ability to access and articulate that foundation on demand.
The engineers who pass senior Kubernetes interviews consistently are not the ones who have memorized the most commands. They are the ones who can walk into a broken cluster and immediately know what to read first, what signal to trust, and what assumption to challenge. That is a practiced skill, not a natural one.
Start Week 1 today. Draw the control plane. Trace the full lifecycle of a pod. By Day 30, you will not just be ready to answer Kubernetes interview questions. You will be ready for the 2 AM incident call that follows.
Read next: [Link: CrashLoopBackOff Kubernetes Debugging Guide] · [Link: Kubernetes Networking Explained] · [Link: CKA Exam Preparation Roadmap]
About the Author
Pratik Shinde is a Senior DevOps Engineer with 10 years of hands-on experience managing Kubernetes clusters in production across financial services, SaaS, and e-commerce environments. He has managed clusters ranging from 12-node development setups to 300-plus node multi-region EKS deployments handling millions of API requests per day. He holds the CKA (Certified Kubernetes Administrator) certification and has interviewed at and been hired by multiple top-tier product companies. He writes about Kubernetes, SRE practices, CI/CD pipelines, and cloud infrastructure for engineers who want to go beyond the basics.
Have a question or want to share your own prep experience? Drop a comment below.
Pratik Shinde
Pratik Shinde is a DevOps and Cloud professional based in Pune, Maharashtra, India, with hands-on experience in building and managing scalable systems. Working in top multinational Organization as Devops Engineer with experience of 10+ years. He has a strong working background in DevOps, Kubernetes, and cloud platforms, along with practical exposure to artificial intelligence and machine learning concepts. He also shares knowledge and learning resources on platforms like LinkedIn and other social channels, aiming to simplify complex topics and make them accessible to a wider audience. Linkedin URL: https://www.linkedin.com/in/pratikshinde8494/ . Github URL: https://github.com/PratikShindeGithub