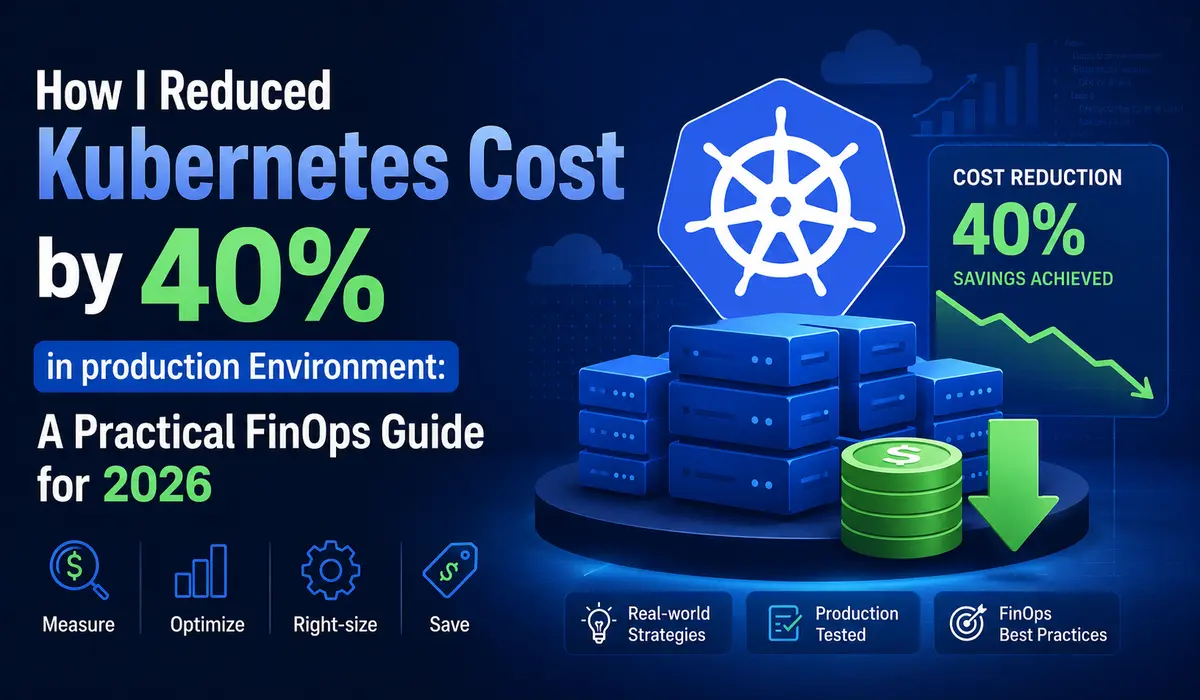
Last quarter, I was handed an EKS bill from a mid-sized SaaS team: $58,000 a month for a workload that, after audit, was using roughly 22% of the compute it was paying for.
The cluster had 47 nodes. Half of them were running at 8% CPU utilization. There were 14 PersistentVolumes attached to pods that had been deleted six months earlier.
Three of the largest deployments had memory requests set to 2Gi because someone, sometime in 2023, had copied a YAML template and never revisited it.
This is not unusual. In my experience auditing Kubernetes clusters across EKS, GKE, and self-managed environments, the typical cluster is overprovisioned by 30% to 60%.
The good news: a disciplined FinOps approach can reliably cut costs by 40% within a quarter without touching application code.
This guide walks you through how I do it, step by step, with the configs and commands I actually use.
Where Kubernetes Costs Actually Come From
Before you can reduce Kubernetes costs, you need to know what you are paying for. Most teams cannot answer this in detail, which is why their first cost-cutting attempts miss.
A typical Kubernetes bill breaks down roughly like this:
- Compute (nodes) — usually 60% to 75% of the total. EC2, GCE, or bare metal.
- Storage — 10% to 20%. EBS, persistent disks, snapshots, and orphaned volumes.
- Networking — 5% to 15%. Cross-AZ traffic, NAT gateways, load balancers.
- Managed control plane — fixed. EKS charges $0.10/hour per cluster; GKE Autopilot charges per pod.
- Observability and add-ons — 5% to 10%. Prometheus storage, log ingestion, service mesh sidecars.
The waste hides in compute and storage. Specifically: nodes running at low utilization, pods with inflated resource requests, and storage that nobody owns. Cross-AZ data transfer is the silent killer most teams ignore until they read a bill line by line.
Step-by-Step Strategy to Reduce Kubernetes Costs
Step 1: Right-size Resource Requests and Limits
This is the highest-leverage change you can make, and most teams do it badly. Kubernetes schedules pods based on requests, not actual usage. If your pod requests 2Gi of memory but uses 400Mi, you are paying for 1.6Gi of headroom on every replica, on every node.
Start by collecting real usage data. Do not guess.
# Quick snapshot of actual pod usage

kubectl top pods -n production --sort-by=memory

# Better: query Prometheus for p95 over 7 days

quantile_over_time(0.95,

  container_memory_working_set_bytes{namespace="production"}[7d]

)
Once you have the data, set requests at roughly 1.2x to 1.4x the p95, and set limits at 1.5x to 2x the request. Here is a real example from a Node.js API service I tuned recently:
# Before: copy-pasted defaults, wildly overprovisioned

resources:

  requests:

    cpu: "1000m"

    memory: "2Gi"

  limits:

    cpu: "2000m"

    memory: "4Gi"

# After: based on 7 days of Prometheus data

# p95 CPU was 180m, p95 memory was 380Mi

resources:

  requests:

    cpu: "250m"

    memory: "512Mi"

  limits:

    cpu: "750m"

    memory: "1Gi"
This single deployment had 12 replicas. The change freed up roughly 9 vCPU and 18Gi of cluster memory, which let the autoscaler shrink the node pool by two m5.xlarge instances. About $280/month per service, and there were 30+ services in the cluster.
A note on CPU limits: I generally recommend setting CPU limits high or omitting them entirely for latency-sensitive workloads.
CPU throttling under tight limits causes more production incidents than overprovisioned CPU costs. Memory limits, on the other hand, should always be set — an unbounded memory leak will take down a node.
Step 2: Use Vertical Pod Autoscaler in Recommendation Mode
Manually right-sizing 50 services is tedious. Vertical Pod Autoscaler (VPA) does the analysis for you. I run it in Off mode (recommendation only) rather than Auto, because automatic resizing causes pod restarts, and I want a human in the loop for production changes.
apiVersion: autoscaling.k8s.io/v1

kind: VerticalPodAutoscaler

metadata:

  name: payment-service-vpa

  namespace: production

spec:

  targetRef:

    apiVersion: apps/v1

    kind: Deployment

    name: payment-service

  updatePolicy:

    updateMode: "Off"   # recommendation only

  resourcePolicy:

    containerPolicies:

      - containerName: '*'

        minAllowed:

          cpu: 50m

          memory: 64Mi
Then read the recommendations:
kubectl describe vpa payment-service-vpa -n production
VPA will print Lower Bound, Target, Uncapped Target, and Upper Bound per container. Apply the Target to your manifest in your next deploy.
Step 3: Configure Horizontal Pod Autoscaler Properly
HPA is standard, but most teams scale on CPU only, which is wrong for I/O-bound workloads. For an API service that spends most of its time waiting on a database, scaling on CPU means you scale too late.
Use custom metrics where it matters — request rate, queue depth, or in-flight requests:
apiVersion: autoscaling/v2

kind: HorizontalPodAutoscaler

metadata:

  name: payment-service-hpa

spec:

  scaleTargetRef:

    apiVersion: apps/v1

    kind: Deployment

    name: payment-service

  minReplicas: 3

  maxReplicas: 30

  metrics:

    - type: Resource

      resource:

        name: cpu

        target:

          type: Utilization

          averageUtilization: 70

    - type: Pods

      pods:

        metric:

          name: http_requests_per_second

        target:

          type: AverageValue

          averageValue: "100"

  behavior:

    scaleDown:

      stabilizationWindowSeconds: 300

      policies:

        - type: Percent

          value: 50

          periodSeconds: 60
The behavior block matters. Without a stabilization window, HPA will scale down too aggressively and trigger cold starts. I have seen this cause p99 latency spikes that masqueraded as application bugs for weeks.
Step 4: Switch to Karpenter (or Cluster Autoscaler with Care)
Cluster Autoscaler works, but it scales node groups, which means you pre-commit to instance types.
Karpenter, on EKS, is significantly better for cost optimization because it provisions nodes just-in-time based on pending pod requirements, and it can pick from a wide pool of instance types and sizes.
A Karpenter NodePool for a mixed workload looks like this:
apiVersion: karpenter.sh/v1

kind: NodePool

metadata:

  name: default

spec:

  template:

    spec:

      requirements:

        - key: kubernetes.io/arch

          operator: In

          values: ["amd64", "arm64"]

        - key: karpenter.sh/capacity-type

          operator: In

          values: ["spot", "on-demand"]

        - key: karpenter.k8s.aws/instance-category

          operator: In

          values: ["c", "m", "r"]

        - key: karpenter.k8s.aws/instance-generation

          operator: Gt

          values: ["3"]

  limits:

    cpu: 1000

  disruption:

    consolidationPolicy: WhenEmptyOrUnderutilized

    consolidateAfter: 30s
Two things make this powerful: consolidationPolicy: WhenEmptyOrUnderutilized actively repacks pods onto fewer nodes when utilization drops, and allowing both spot and arm64 opens access to cheaper instance pools.
On one cluster I migrated from Cluster Autoscaler to Karpenter, node costs dropped 28% in the first week without any application changes.
Step 5: Run Stateless Workloads on Spot Instances
Spot instances (or GCP preemptibles) are 60% to 90% cheaper than on-demand. The trade-off is that they can be reclaimed with two minutes of notice.
This is fine for stateless workloads web servers, background workers, batch jobs and a bad idea for anything stateful.
The honest risks: in regions with high spot demand, interruption rates can spike to 15%+ for popular instance types. If your workload cannot tolerate brief disruption, spot will hurt you. Mitigate this by:
- Diversifying instance types in your Karpenter NodePool (more pools = lower correlated interruption)
- Setting terminationGracePeriodSeconds: 120 so pods drain cleanly
- Using PodDisruptionBudgets to keep at least N replicas alive during evictions
- Keeping critical components (ingress controllers, databases, cert-manager) on on-demand nodes
# Tag stateless deployments to land on spot

spec:

  template:

    spec:

      nodeSelector:

        karpenter.sh/capacity-type: spot

      tolerations:

        - key: spot

          operator: Equal

          value: "true"

          effect: NoSchedule
Step 6: Hunt Down Unused Resources
This is unglamorous but pays well. Every cluster I audit has orphaned PersistentVolumes, unused LoadBalancer Services, idle Deployments scaled to zero replicas but still holding ConfigMaps and Secrets, and abandoned namespaces from old projects.
# Find PVCs not bound to any running pod

kubectl get pvc --all-namespaces -o json | \

  jq -r '.items[] | select(.status.phase=="Bound") | "\(.metadata.namespace) \(.metadata.name)"'

# Cross-reference with pod mounts

kubectl get pods --all-namespaces -o json | \

  jq -r '.items[].spec.volumes[]?.persistentVolumeClaim?.claimName' | sort -u

# Find LoadBalancer services (each one costs ~$18/month on AWS)

kubectl get svc --all-namespaces --field-selector spec.type=LoadBalancer

# Deployments with zero replicas (often forgotten)

kubectl get deploy --all-namespaces -o json | \

  jq -r '.items[] | select(.spec.replicas==0) | "\(.metadata.namespace) \(.metadata.name)"'
In the cluster I mentioned at the start, this exercise alone surfaced 14 orphaned EBS volumes totaling 2.1TB — about $210/month of pure waste.
Step 7: Storage Optimization
EBS gp2 is the default on many older EKS clusters. gp3 is roughly 20% cheaper for the same baseline IOPS and is almost always the right choice. Migrate via a new StorageClass:
apiVersion: storage.k8s.io/v1

kind: StorageClass

metadata:

  name: gp3

provisioner: ebs.csi.aws.com

parameters:

  type: gp3

  iops: "3000"

  throughput: "125"

volumeBindingMode: WaitForFirstConsumer

allowVolumeExpansion: true
Also enable snapshot lifecycle policies. Snapshot sprawl is real, I have seen single accounts with $4,000/month in old EBS snapshots nobody could identify.
Step 8: Observability for Cost Tracking
You cannot reduce Kubernetes costs you cannot see. Install Kubecost or OpenCost and tag workloads by team and environment. Without per-namespace and per-label cost allocation, you have no way to push accountability to the teams that own the spend.
# Install OpenCost via Helm

helm repo add opencost https://opencost.github.io/opencost-helm-chart

helm install opencost opencost/opencost -n opencost --create-namespace
Pair this with AWS Cost Explorer or GCP Billing exports to BigQuery for a full picture.
Kubecost shows you cluster-internal allocation, but cross-AZ data transfer and managed service costs only show up in the cloud provider’s billing data.
Real Case Study: SaaS Platform on EKS
The cluster I opened with — let me give you the full numbers.
Before:
- 47 nodes (m5.xlarge, all on-demand)
- $58,000/month total ($42,000 compute, $9,000 storage, $7,000 networking and other)
- Average cluster CPU utilization: 22%
- 14 orphaned PVCs (2.1TB)
Changes made over 8 weeks:
- Right-sized resource requests across 34 services using VPA recommendations
- Migrated from Cluster Autoscaler to Karpenter with mixed spot/on-demand NodePools
- Moved stateless workers to spot (about 60% of compute)
- Migrated all gp2 volumes to gp3
- Deleted 14 orphaned PVCs and 6 unused LoadBalancers
- Consolidated three small dev clusters into one with namespace isolation
After:
- 19 nodes (mix of c6i, m6i, r6i; 60% spot, 40% on-demand)
- $34,800/month total — a 40% reduction
- Average cluster CPU utilization: 58%
- One spot interruption incident in the first month (handled by PDBs, no customer impact)
The migration was not free. About 60 engineering hours across two engineers, plus one Saturday maintenance window. ROI was under three weeks.
Cost Breakdown: Before vs After
| Metric | Before | After |
|---|---|---|
| Monthly cost | $58,000 | $34,800 |
| Node count | 47 | 19 |
| Avg CPU utilization | 22% | 58% |
| Spot share | 0% | 60% |
| Orphaned PVCs | 14 | 0 |
Common Mistakes to Avoid
- Setting CPU limits aggressively. CPU throttling causes latency that looks like a bug. Memory limits, yes; CPU limits, usually no.
- Running databases on spot instances. Stateful workloads do not belong there. The interruption cost will exceed the savings.
- Right-sizing once and walking away. Workloads change. Re-run VPA recommendations quarterly.
- Trusting kubectl top for capacity planning. It shows current usage, not p95 over time. Use Prometheus.
- Ignoring cross-AZ traffic. A chatty service mesh across three AZs can add $3,000/month in data transfer. Use topology-aware routing.
- Scaling everything with HPA on CPU. I/O-bound services should scale on request rate or queue depth, not CPU.
- Treating dev and prod the same. Dev clusters can run 100% spot, scale to zero overnight, and use much smaller instances. Most teams do not do this.
Tools That Actually Help
Kubecost: Best UI, strong namespace and label allocation. Paid tiers get pricey for large clusters. Open-core model can feel limiting on the free tier.
OpenCost: The open-source upstream of Kubecost. Less polished UI, but the data is the same. Good if you already run Grafana and want raw metrics.
Karpenter: Best node autoscaler for EKS. GKE has Autopilot which is conceptually similar. The trade-off is operational complexity; you need to understand NodePool configuration well or you will get surprised by instance choices.
Goldilocks: Wrapper around VPA that gives you a clean dashboard of right-sizing recommendations per namespace. Good for getting buy-in from teams.
AWS Cost Explorer / GCP Billing: Non-negotiable for understanding the full bill. Kubecost cannot see cross-AZ transfer, NAT gateway costs, or managed service spend. Always cross-reference.
Final Checklist
- Install OpenCost or Kubecost. Get visibility before you optimize.
- Run VPA in recommendation mode on all production deployments.
- Right-size resource requests based on 7-day p95 from Prometheus.
- Configure HPA with custom metrics for I/O-bound workloads.
- Migrate to Karpenter (EKS) or tune Cluster Autoscaler aggressively.
- Move stateless workloads to spot instances with diversified pools.
- Set up PodDisruptionBudgets for spot-tolerant services.
- Audit and delete orphaned PVCs, LoadBalancers, and zero-replica deployments monthly.
- Migrate gp2 to gp3 and enable snapshot lifecycle policies.
- Tag workloads by team. Push cost accountability down.
A 40% reduction is realistic for an unoptimized cluster. Beyond that, returns diminish and the operational cost of squeezing the last 10% often exceeds the savings.
FAQ
How long does it take to reduce Kubernetes costs by 40%?
For a typical mid-sized cluster, six to ten weeks of focused work. The first 20% comes from right-sizing and deleting unused resources, which is fast. The next 20% requires Karpenter migration and spot adoption, which involves more careful testing.
Is Karpenter better than Cluster Autoscaler for cost optimization?
In my experience, yes — on EKS specifically. Karpenter’s bin-packing and instance-type flexibility consistently produces 15% to 30% better utilization. On other platforms, native options like GKE Autopilot or Cluster Autoscaler with mixed instance node pools can get close.
Can I run production workloads on spot instances safely?
Stateless workloads, yes, with proper PodDisruptionBudgets, diversified instance pools, and graceful shutdown handling. Stateful workloads — databases, queues, anything with local persistent state — should stay on on-demand. Critical control-plane components should also stay on on-demand.
You can also read more articles related kubernetes
How do I track Kubernetes cost savings over time?
Tag every workload with team and environment labels. Use Kubecost or OpenCost for cluster-internal allocation, and export your cloud provider’s billing data to BigQuery or Athena for the full picture. Track cost-per-request or cost-per-tenant rather than absolute spend — it normalizes for growth.
What is the biggest mistake teams make when trying to cut Kubernetes costs?
Optimizing without measuring first. I have seen teams spend weeks tuning HPA configurations only to discover their actual cost driver was 14TB of unused EBS snapshots. Always start with a Kubecost or OpenCost dashboard and a line-by-line review of the cloud bill before changing anything.
Pratik Shinde
Pratik Shinde is a DevOps and Cloud professional based in Pune, Maharashtra, India, with hands-on experience in building and managing scalable systems. Working in top multinational Organization as Devops Engineer with experience of 10+ years. He has a strong working background in DevOps, Kubernetes, and cloud platforms, along with practical exposure to artificial intelligence and machine learning concepts. He also shares knowledge and learning resources on platforms like LinkedIn and other social channels, aiming to simplify complex topics and make them accessible to a wider audience. Linkedin URL: https://www.linkedin.com/in/pratikshinde8494/ . Github URL: https://github.com/PratikShindeGithub