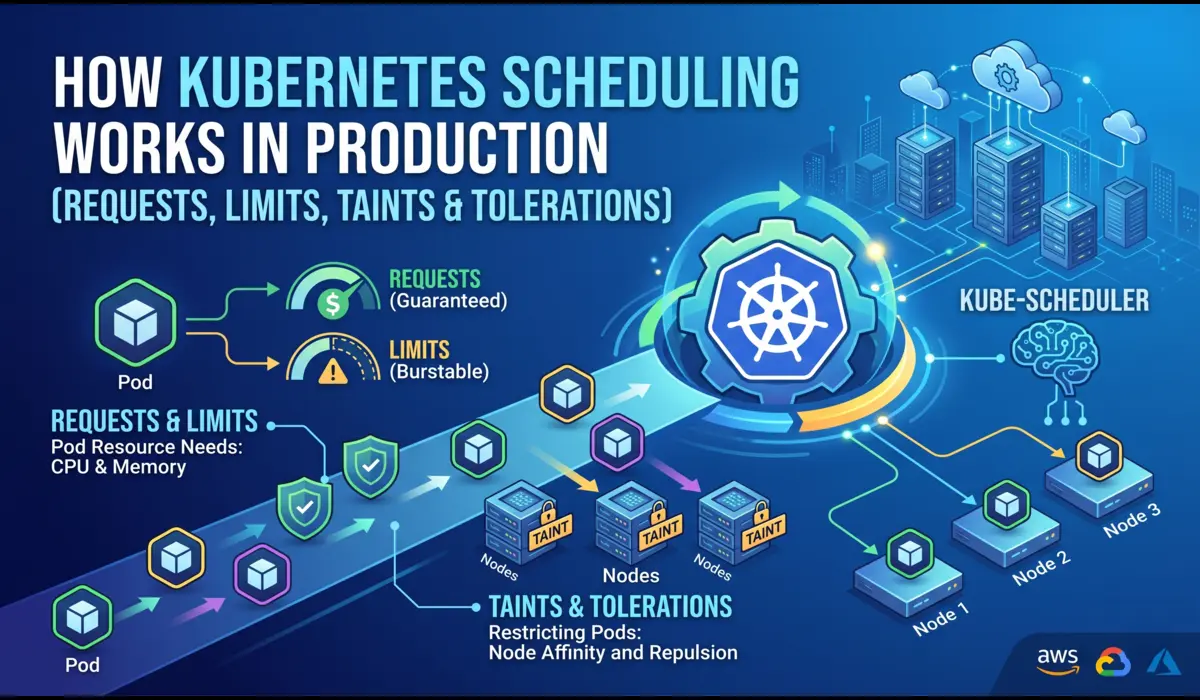
Requests, Limits, Taints, and Tolerations — What Actually Happens at Runtime
Based on experience running Kubernetes workloads in production environments handling real traffic across multi-tenant clusters.
Introduction
Kubernetes scheduling is one of those topics that looks simple on paper and bites you in production. You read the docs, you understand that pods go on nodes, you set some resource requests — and then you hit your first Pending pod at 2 AM during a traffic spike, and you realize you never actually understood how the scheduler makes its decisions.
This article does not walk through kubectl run syntax. It explains what the scheduler actually does when it sees a new pod, why requests and limits behave differently than most engineers expect, how QoS classes determine which workloads get killed first, and what taints and tolerations look like when they go wrong in production. Every section is grounded in real failure modes — the kind you encounter when you are running dozens of nodes across multiple teams sharing the same cluster.
How Kubernetes Scheduling Actually Works
The Journey from Pending to Running
When you apply a pod manifest, the API server accepts it and writes it to etcd. The pod exists — but it has no node assigned. The kube-scheduler is watching for exactly this: pods with an empty spec.nodeName field. It picks the pod up and runs it through a two-phase process before binding it to a node.
Phase 1: Filtering (Feasibility)
The scheduler runs every node through a series of filter plugins. Any node that fails a filter is eliminated from consideration entirely. The relevant filters for most production clusters:
- NodeResourcesFit — does the node have enough allocatable CPU and memory to satisfy the pod’s requests (not limits)?
- NodeAffinity / PodAffinity — are the affinity rules satisfied?
- TaintToleration — does the pod tolerate all taints on the node?
- VolumeBinding — if the pod needs a PVC, is there a matching PV available on or accessible from this node?
- NodeUnschedulable — is the node cordoned?
A critical point that trips up engineers: the filter uses requests, not limits. If your node has 4 GiB of allocatable memory and you have scheduled 3.8 GiB worth of pod requests on it, a new pod requesting 500 MiB will not schedule there — even if actual runtime memory usage is only 2 GiB. The scheduler works with committed capacity, not observed usage.
| 💡 Key Insight: Scheduling is based on requests. Operations are bounded by limits. These are two different things with two different effects. |
Phase 2: Scoring (Preference)
After filtering, the scheduler scores the remaining eligible nodes. Default scoring plugins include LeastAllocated (prefer nodes with more free capacity) and BalancedResourceAllocation (prefer nodes where CPU and memory usage are balanced). The pod goes to the highest-scoring node. If two nodes tie, the scheduler picks one at random.
This is why you can have a lopsided cluster — nodes where CPU is nearly exhausted but memory is underutilized — because each scheduling decision is made independently and the scoring is a heuristic, not a global optimization.
What kubectl describe pod Tells You About Scheduling
$ kubectl describe pod <pod-name> -n <namespace>


# Look for the Events section at the bottom:
Events:
  Type     Reason            Age   From               Message
  ----     ------            ----  ----               -------
  Warning  FailedScheduling  12s   default-scheduler  0/6 nodes are available:
                                                       3 node(s) had taint {dedicated: gpu},
                                                       that the pod didn't tolerate.
                                                       2 node(s) had insufficient memory.
                                                       1 node(s) had insufficient cpu.
When a pod is stuck in Pending, your first command should be:
That single event line tells you exactly why scheduling failed: three nodes are GPU-dedicated (tainted), two are out of memory capacity, one is out of CPU capacity. You can map each of these to a specific fix without guessing.
Requests vs. Limits — Real Implications, Not Definitions
Most engineers know the textbook difference. Requests are what the scheduler uses for placement. Limits are what the cgroups enforce at runtime. What most engineers do not fully internalize is how these interact with node pressure, OOM kills, and CPU throttling.
A Realistic Pod Spec
apiVersion: v1
kind: Pod
metadata:
  name: payment-worker
  namespace: prod
spec:
  containers:
  - name: payment-worker
    image: payments:v2.4.1
    resources:
      requests:
        memory: "256Mi"
        cpu: "250m"
      limits:
        memory: "512Mi"
        cpu: "1000m"
What this actually means at runtime: the scheduler will only place this pod on a node that has 256 MiB and 250m CPU available in its allocatable pool. Once the pod is running, the container can use up to 512 MiB of memory before being OOMKilled, and up to 1000m CPU — but excess CPU usage triggers throttling, not a kill.
CPU Throttling Is Silent and Expensive
This is the most underappreciated behavior in Kubernetes resource management. If your container’s CPU usage exceeds its limit, Linux’s CFS (Completely Fair Scheduler) throttles it. The container does not crash. It does not restart. It just runs slower. In latency-sensitive services — API handlers, payment processing, real-time pipelines — this can manifest as p99 latency spikes that are extremely hard to attribute to throttling without metrics.
To detect CPU throttling, check the container_cpu_cfs_throttled_seconds_total metric in Prometheus or use:
$ kubectl top pod payment-worker -n prod
NAME              CPU(cores)   MEMORY(bytes)
payment-worker    980m         298Mi


# 980m against a 1000m limit = near-certain throttling
# Check cgroup stats on the node for confirmation:
$ cat /sys/fs/cgroup/cpu/kubepods/.../cpu.stat
nr_throttled 4821
throttled_time 38291847193| ⚠️ Setting CPU limits too close to average usage is a common cause of latency degradation. If your service runs at 900m on average but spikes to 1100m on burst traffic, a 1000m limit will throttle it on every spike. |
Memory OOMKill — When Limits Are Not What You Think
Memory is enforced hard. When a container crosses its memory limit, the kernel OOMKiller selects a process to kill. Kubernetes registers this as exit code 137 and marks the container as OOMKilled. But there are subtleties:
- For JVM applications, the heap limit (set via -Xmx) is not the total memory footprint. Off-heap memory — metaspace, thread stacks, code cache, native buffers — is additional. A JVM configured with -Xmx512m on a pod with a 512Mi memory limit will OOMKill almost immediately.
- Go and Python runtimes also have runtime overhead beyond application allocations.
- The OOMKill can happen on the container, not the pod — meaning if you have a sidecar, the wrong container may get killed first.
Correct JVM memory configuration for a container with a 768Mi limit:
env:
  - name: JAVA_OPTS
    value: "-Xms256m -Xmx512m -XX:MaxMetaspaceSize=128m -XX:ReservedCodeCacheSize=64m"


# Total footprint estimate:
# Heap: 512m + Metaspace: 128m + Code cache: 64m + Threads/misc: ~50m
# = ~754m — fits within 768Mi with minimal headroom
# Set limits to 768Mi, not 512Mi, or you WILL get OOMKilled
QoS Classes and Why They Matter Under Node Pressure
Kubernetes assigns every pod a QoS (Quality of Service) class based on how its requests and limits are configured. This class determines eviction priority when a node is under memory pressure — which workloads get evicted first.
| QoS Class | Condition | Eviction Priority |
| Guaranteed | Requests == Limits for ALL containers | Last to be evicted |
| Burstable | Requests set, Limits > Requests (or only one set) | Middle — evicted after BestEffort |
| BestEffort | No requests or limits set on any container | First to be evicted |
In practice: production services should be Guaranteed or Burstable with conservative request values. BestEffort is only appropriate for batch jobs or non-critical workloads that can tolerate eviction without notice. Setting no resource limits at all is not a neutral choice — it puts your workload at highest eviction risk and makes it a noisy neighbor to everything else on the node.
Check a pod’s QoS class:
$ kubectl get pod payment-worker -n prod -o jsonpath='{.status.qosClass}'
Burstable
Taints and Tolerations — Production Use Cases
Taints and tolerations are the mechanism Kubernetes provides to reserve nodes for specific workloads. A taint on a node repels pods. A toleration on a pod allows it to schedule onto a tainted node. Neither alone is sufficient for true node dedication — you also need node affinity to attract pods, because a toleration just removes the repulsion, it does not create an attraction.
Tainting a Node
# Taint a node for GPU workloads only
$ kubectl taint nodes gpu-node-01 dedicated=gpu:NoSchedule


# Taint effects:
# NoSchedule    — new pods without toleration won't schedule here
# PreferNoSchedule — scheduler avoids this node but can use it if needed
# NoExecute     — evicts existing pods without toleration AND blocks new ones
Pod with Toleration and Affinity
spec:
  tolerations:
  - key: "dedicated"
    operator: "Equal"
    value: "gpu"
    effect: "NoSchedule"
  affinity:
    nodeAffinity:
      requiredDuringSchedulingIgnoredDuringExecution:
        nodeSelectorTerms:
        - matchExpressions:
          - key: dedicated
            operator: In
            values:
            - gpu
The toleration alone does not guarantee the pod goes to the GPU node — it just means it can. Without the nodeAffinity block, the pod may schedule on any other untainted node in the cluster. This is a very common misconfiguration.
Real Production Use Cases for Taints
- Dedicated GPU nodes — only ML inference or training pods schedule there
- High-memory nodes — only memory-intensive workloads like analytics pipelines
- Spot/preemptible nodes — stateless batch jobs tolerate the spot taint; stateful services do not
- Maintenance isolation — cordon and taint a degraded node to drain it without affecting other nodes
- Multi-tenancy — team A’s workloads only go to team A’s nodes
What Goes Wrong in Production
Scenario 1: Pods Stuck in Pending During Traffic Spike
Symptom
HPA (Horizontal Pod Autoscaler) triggers scale-out during peak traffic. New pods are created but stay in Pending indefinitely. Alerts fire for high latency as existing pods are overloaded.
Root Cause
The cluster has sufficient node count, but memory requests across all pods have exhausted the allocatable memory pool. Allocatable memory is not the same as total node memory — it is total memory minus kube-reserved (for kubelet and system daemons) and eviction threshold. On a 16 GiB node, allocatable memory might be 13.5 GiB. If pods with requests totaling 13.5 GiB are already scheduled, new pods cannot be placed regardless of actual runtime usage.
Debugging Commands
# Check what's consuming allocatable capacity
$ kubectl describe node <node-name> | grep -A10 'Allocated resources'


Allocated resources:
  (Total limits may be over 100 percent, i.e., overcommitted.)
  Resource           Requests     Limits
  --------           --------     ------
  cpu                3850m (96%)  7200m (180%)
  memory             12.8Gi (94%) 19.2Gi (141%)


# 94% memory requests means almost no headroom for new pods
# despite limits being 141% (overcommitted)


# Check pending pods and their events
$ kubectl get events -n prod --field-selector reason=FailedScheduling
Fix
Short term: add nodes or reduce request values for non-critical workloads. Long term: implement Cluster Autoscaler with properly configured node groups so that new nodes are provisioned before the allocatable pool exhausts. Set PodDisruptionBudgets so the autoscaler can safely evict lower-priority pods to make room.
Scenario 2: Misconfigured Taint Blocks a Critical Deployment
Symptom
A new deployment rolls out as part of a CI/CD pipeline. All 6 replicas are stuck in Pending. The service is down. The taint was added to the node group the previous week as part of a cluster segmentation project.
Root Cause
$ kubectl describe pod api-server-7f8b9d-xk2mp -n prod
Events:
  Warning  FailedScheduling  30s  default-scheduler
           0/8 nodes are available: 8 node(s) had taint
           {team: platform} that the pod didn't tolerate.
The platform team added a taint team=platform:NoSchedule to all production nodes to reserve them for platform workloads. But the api-server deployment was not updated with the corresponding toleration. Every node now rejects it.
Fix
Immediate: add the toleration to the deployment manifest and redeploy. Root cause: taint/toleration changes need to be coordinated with all workloads that run on the affected nodes before the taint is applied, or done with PreferNoSchedule effect initially as a migration step.
# Add toleration to the deployment
$ kubectl patch deployment api-server -n prod --type=json \
  -p='[{"op":"add","path":"/spec/template/spec/tolerations",
  "value":[{"key":"team","operator":"Equal","value":"platform",
  "effect":"NoSchedule"}]}]'
CPU Throttling Causing Latency Spikes
Symptom
p99 API latency spikes from 80ms to 450ms during business hours. No errors in logs. Pod is Running and healthy. Memory usage is normal. Restarting pods temporarily resolves it, but the problem returns.
Root Cause
CPU limits are set to 500m. During peak traffic, the container needs 650-700m of CPU. Linux CFS throttles it, adding up to hundreds of milliseconds of artificial latency per request during throttled periods.
Fix
Either remove the CPU limit entirely (acceptable for latency-sensitive services if your nodes have enough headroom) or raise it to 1000m with corresponding node capacity. Monitor container_cpu_cfs_throttled_seconds_total per container to detect throttling before it affects users.
Memory Eviction Cascade
Symptom
Multiple pods across a node are evicted simultaneously during a memory pressure event. Some are critical services. The node never recovers because evicted pods reschedule back onto the same node and trigger another eviction cycle.
Root Cause
BestEffort and Burstable pods have high actual memory usage, causing the kubelet to cross the eviction threshold (default: 100 MiB available). Kubelet evicts pods in order: BestEffort first, then Burstable by usage-over-request ratio. If the cluster has no other nodes with capacity, evicted pods schedule back immediately.
Fix
Set memory requests on all workloads (eliminate BestEffort class for production pods). Configure the kubelet eviction threshold higher (–eviction-hard memory.available<500Mi) so eviction starts earlier and with less urgency. Use Cluster Autoscaler to add capacity before eviction pressure hits.
Debugging Checklist
Pod Stuck in Pending
# Step 1: Get the scheduling failure reason
$ kubectl describe pod <pod> -n <ns> | grep -A20 Events


# Step 2: Check node allocatable capacity
$ kubectl describe nodes | grep -A8 'Allocated resources'


# Step 3: Check for taints on nodes
$ kubectl get nodes -o custom-columns=NAME:.metadata.name,TAINTS:.spec.taints


# Step 4: Verify pod tolerations
$ kubectl get pod <pod> -n <ns> -o jsonpath='{.spec.tolerations}'


# Step 5: Check if PVC is bound (if pod uses persistent storage)
$ kubectl get pvc -n <ns>
Diagnosing CPU Throttling
# Check throttling via Prometheus (if available)
rate(container_cpu_cfs_throttled_seconds_total[5m])
  / rate(container_cpu_cfs_periods_total[5m])


# Values above 0.25 (25%) indicate significant throttling


# Check live CPU usage vs limit
$ kubectl top pods -n <ns> --containers
Diagnosing OOMKill
# Check last termination state
$ kubectl describe pod <pod> -n <ns> | grep -A10 'Last State'


Last State:     Terminated
  Reason:       OOMKilled
  Exit Code:    137


# Check node memory pressure
$ kubectl describe nodes | grep -A5 MemoryPressure


# Check actual usage vs requests across namespace
$ kubectl top pods -n prod --sort-by=memory
Practical Best Practices
Set Requests Based on Profiling, Not Intuition
Run your workload under realistic load in staging. Capture p95 and p99 memory and CPU usage. Set memory requests at p99 usage and memory limits at 1.3x–1.5x that value. For CPU, set requests at average usage and set limits cautiously — or omit them for latency-sensitive services and rely on namespace ResourceQuotas to cap total consumption instead.
Use Namespace ResourceQuotas as the Safety Net
apiVersion: v1
kind: ResourceQuota
metadata:
  name: prod-quota
  namespace: prod
spec:
  hard:
    requests.cpu: "20"
    requests.memory: 40Gi
    limits.memory: 80Gi
This ensures that no single namespace can consume unbounded cluster resources, even if individual pod limits are unset or generous.
Use LimitRange to Enforce Defaults
If your teams forget to set requests and limits, LimitRange injects defaults. This prevents BestEffort pods from ending up in production without explicit intent:
apiVersion: v1
kind: LimitRange
metadata:
  name: default-limits
  namespace: prod
spec:
  limits:
  - type: Container
    defaultRequest:
      cpu: 100m
      memory: 128Mi
    default:
      cpu: 500m
      memory: 256Mi
    max:
      cpu: "4"
      memory: 4Gi
Apply Taints Incrementally
Never add a NoSchedule taint to a node group without first auditing all workloads that run on those nodes. The process: audit existing pods, add tolerations to all required workloads, apply taint. If you are unsure, use PreferNoSchedule first to see what gets displaced, then switch to NoSchedule once you are confident.
Alert on Pending Pod Count, Not Just Running
A pod that has been Pending for more than 60 seconds is a signal that something is wrong with scheduling. Add a Prometheus alert on kube_pod_status_phase{phase=’Pending’} with a threshold of 2+ minutes. Do not wait for the on-call to notice the HPA is not scaling.
# Prometheus alert rule
- alert: PodStuckPending
  expr: kube_pod_status_phase{phase='Pending'} == 1
  for: 2m
  annotations:
    summary: "Pod {{ $labels.pod }} has been Pending for over 2 minutes"
Conclusion
Kubernetes scheduling is not a black box — once you understand the two-phase process, the difference between requests and limits, how QoS classes are assigned, and how taints interact with tolerations, most production scheduling failures become predictable and diagnosable within minutes.
The mental model to carry: requests are promises to the scheduler, limits are enforcement at runtime, QoS determines survival order under pressure, and taints are access controls on nodes. Misconfigure any of these and the symptoms surface as Pending pods, OOMKills, latency spikes, or eviction cascades — each with a distinct diagnostic signature.
The engineers who resolve scheduling incidents quickly are not the ones who know the most Kubernetes flags. They are the ones who read describe output carefully, check allocatable capacity before assuming it is a code problem, and understand that the scheduler is making rational decisions — just based on the configuration they gave it.
| 💡 Invest in request/limit profiling before going to production, not after your first OOMKill incident. The data is easy to collect; the outage is not easy to explain. |
FAQ
Why does my node show free memory in kubectl top but pods still won’t schedule?
kubectl top shows actual usage. The scheduler uses requests, not usage. If you have 8 GiB of actual free memory but 8 GiB worth of memory requests already committed, the scheduler treats the node as full. Reduce request values for pods that are over-requesting, or add nodes.
Can I run a pod without any resource requests?
Yes, but it becomes BestEffort class and will be the first evicted under node memory pressure. In production namespaces, use a LimitRange with defaultRequest to ensure all pods get minimum requests set automatically.
Why is my tainted node still accepting pods that don’t have tolerations?
Check the taint effect. If the effect is PreferNoSchedule, the scheduler will try to avoid the node but can use it if no other node is available. Only NoSchedule blocks scheduling absolutely. Also verify the taint is on the node with: kubectl get node <name> -o jsonpath='{.spec.taints}’.
What is the difference between node affinity and nodeSelector?
nodeSelector is the older, simpler mechanism — it matches exact labels. Node affinity is more expressive: it supports operators (In, NotIn, Exists, Gt, Lt), and it distinguishes between required (hard) and preferred (soft) rules. For new workloads, use nodeAffinity. nodeSelector still works but cannot express the same constraints.
Should I always set CPU limits?
For latency-sensitive services, consider omitting CPU limits and controlling total namespace consumption with ResourceQuota. CPU limits cause throttling (not kills), which is often worse for user-facing services than running slightly over the intended CPU budget. For batch jobs and background workers, CPU limits are appropriate — they should not consume unbounded CPU at the expense of other workloads.
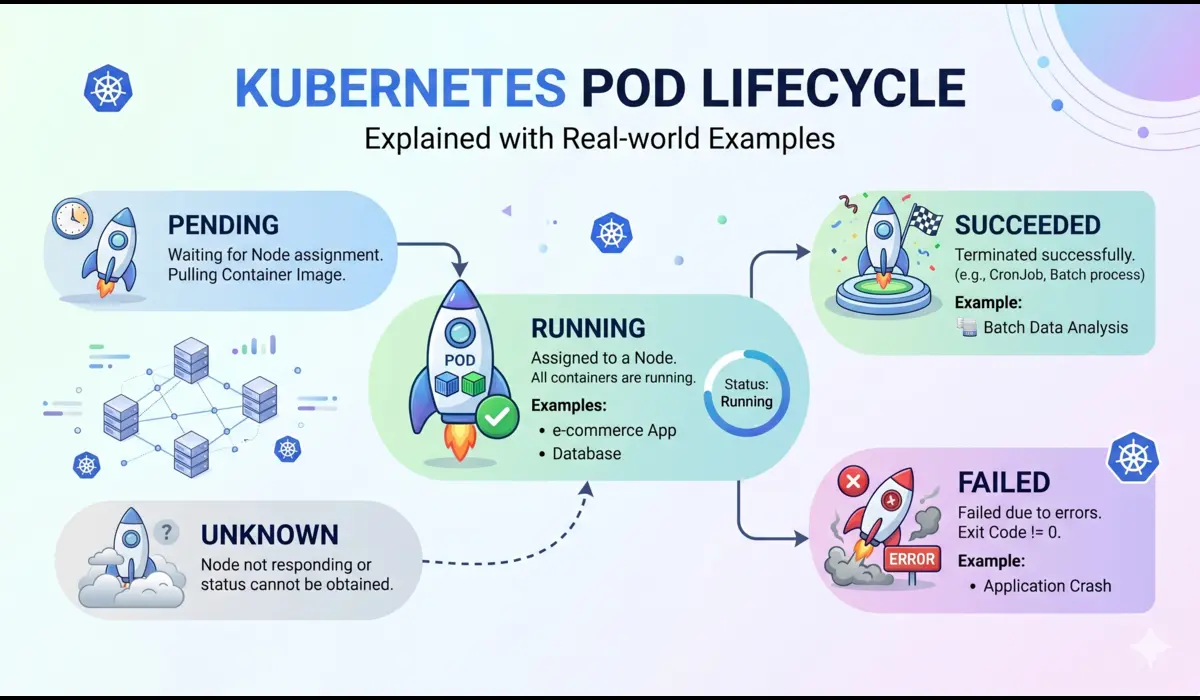
You can also read: Kubernetes pod cycle
Pratik Shinde
Pratik Shinde is a DevOps and Cloud professional based in Pune, Maharashtra, India, with hands-on experience in building and managing scalable systems. Working in top multinational Organization as Devops Engineer with experience of 10+ years. He has a strong working background in DevOps, Kubernetes, and cloud platforms, along with practical exposure to artificial intelligence and machine learning concepts. He also shares knowledge and learning resources on platforms like LinkedIn and other social channels, aiming to simplify complex topics and make them accessible to a wider audience. Linkedin URL: https://www.linkedin.com/in/pratikshinde8494/ . Github URL: https://github.com/PratikShindeGithub