A Production Troubleshooting Guide for Kubernetes Engineers
The 3 AM Alert You Never Want to See
It is 3:12 AM. Your on-call phone fires. PagerDuty: payment-service in the prod namespace has been restarting every 90 seconds for the last 15 minutes. Orders are failing. Engineers are being paged in. You SSH into your bastion, pull up kubectl, and see this:
$ kubectl get pods -n prod
NAME READY STATUS RESTARTS AGE
payment-service-7d9f4b6c8-xk2mp 0/1 CrashLoopBackOff 8 12m
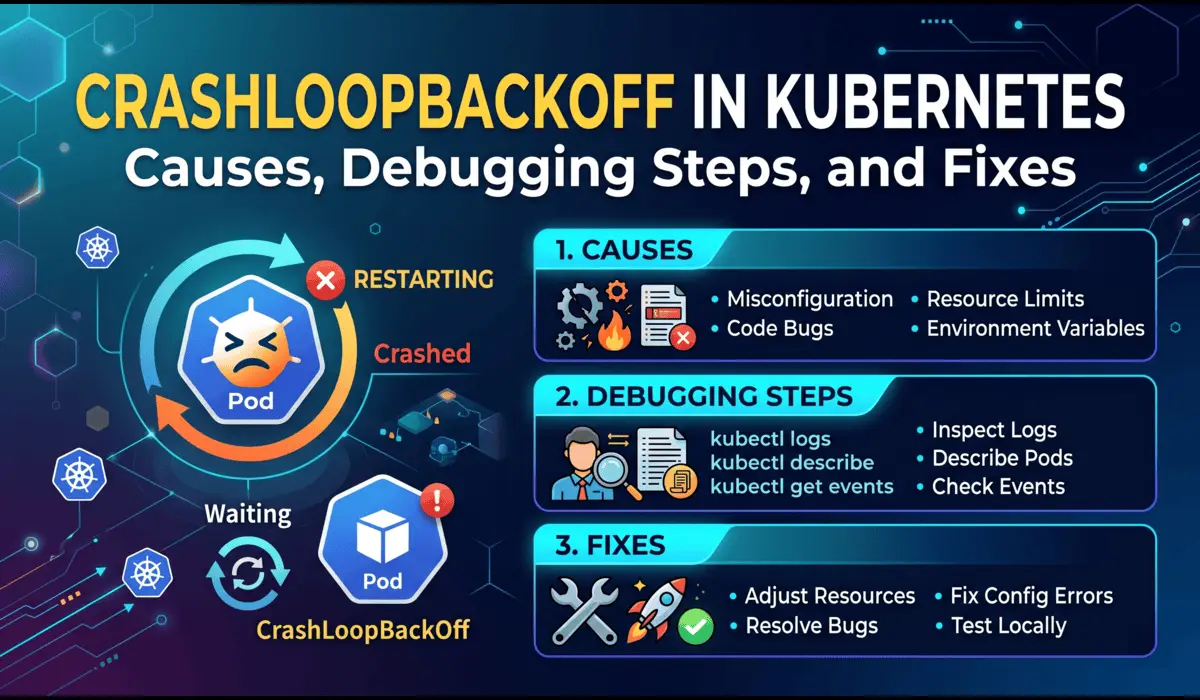
payment-service-7d9f4b6c8-rp9nw 0/1 CrashLoopBackOff 7 12mThat status — CrashLoopBackOff — is Kubernetes telling you: your container started, crashed, and I tried to restart it, but it kept crashing, so now I am backing off.
The frustrating part is that CrashLoopBackOff is not one problem. It is a symptom. Behind that status could be a misconfigured environment variable, a missing secret, an OOM kill, a failed readiness probe, or a bug introduced in the last deployment. This guide walks you through the exact methodology to isolate and fix each cause in production — fast.
What CrashLoopBackOff Actually Means
When a container exits with a non-zero exit code, Kubernetes restarts it automatically. But it does not restart indefinitely at full speed — it uses exponential backoff: 10s, 20s, 40s, 80s, 160s, up to a ceiling of 5 minutes between attempts.
The backoff timer resets after a pod runs successfully for 10 minutes. If your container never stays up that long, the restarts keep accumulating and the wait time between them keeps growing.
| Key distinction: CrashLoopBackOff is a pod condition, not an error code. The actual error lives inside the container logs, exit codes, and events — not in the status string itself. |
Root Causes — Ranked by Frequency
In my experience running Kubernetes in production across multiple clusters and teams, here are the causes I encounter most often, in order:
- Application crashes on startup (unhandled exception, missing dependency)
- Missing or incorrect environment variables and secrets
- OOM (Out of Memory) kill — container exceeds its memory limit
- Misconfigured liveness or readiness probes
- Wrong container image or failed image pull (edge case)
- Insufficient permissions (RBAC, file system, network policy)
- Init container failures blocking the main container from starting
Each of these has a different debugging path. Do not guess — follow the signals.
Step-by-Step Debugging Process
Step 1: Gather Immediate Context
Your first command should always be describe, not logs. The describe output gives you events, exit codes, probe failures, and OOM signals in one place.
$ kubectl describe pod payment-service-7d9f4b6c8-xk2mp -n prodLook for these sections in the output:
- Last State — shows exit code of the previous container run
- Events — shows OOMKilled, Back-off restarting, probe failures
- Limits/Requests — helps identify memory pressure
Exit code 137 means the container was killed by the kernel (OOM or external SIGKILL). Exit code 1 means the app crashed with a standard error. Exit code 127 means the entrypoint binary was not found.
Step 2: Pull the Previous Container Logs
This is the single most missed step by junior engineers. When a pod is in CrashLoopBackOff, kubectl logs gives you the current (often empty) container. You need the previous run:
# Get logs from the crashed (previous) container
$ kubectl logs payment-service-7d9f4b6c8-xk2mp -n prod --previous


# If there are multiple containers in the pod
$ kubectl logs payment-service-7d9f4b6c8-xk2mp -n prod --previous -c payment-service


# Tail last 100 lines to reduce noise
$ kubectl logs payment-service-7d9f4b6c8-xk2mp -n prod --previous --tail=100
What you are looking for: a stack trace, a connection refused error, a missing config key, or a panic message. In most cases, the root cause is in the last 10 lines of the previous log.
Step 3: Check Exit Code and OOM Status
Exit code 137 is the most important signal for OOM. Confirm it from describe output:
Last State: Terminated
  Reason:    OOMKilled
  Exit Code: 137
  Started:   Sat, 18 Apr 2026 02:58:12 +0000
  Finished:  Sat, 18 Apr 2026 03:01:04 +0000
If you see OOMKilled, do not just increase the memory limit blindly. First check whether the application actually has a memory leak, or whether the limit was set too low relative to real-world usage. Use:
# Check current resource usage across all pods in namespace
$ kubectl top pods -n prod


# Check node-level memory pressure
$ kubectl describe nodes | grep -A5 'Conditions:'
Step 4: Validate Environment Variables and Secrets
A huge number of production CrashLoopBackOff incidents are caused by a missing or malformed environment variable — a Vault secret that was not synced, a ConfigMap key that was renamed in the deployment but not in the application code, or a base64 encoding error in a Secret.
# Inspect the running pod's environment
$ kubectl exec -it payment-service-7d9f4b6c8-xk2mp -n prod -- env | sort


# If pod won't start, check the deployment manifest directly
$ kubectl get deployment payment-service -n prod -o yaml | grep -A30 'env:'


# Decode a secret to verify its value
$ kubectl get secret db-credentials -n prod -o jsonpath='{.data.password}' | base64 -d
A common YAML misconfiguration that causes this:
 WRONG - secretKeyRef points to wrong key name
env:
  - name: DB_PASSWORD
    valueFrom:
      secretKeyRef:
        name: db-credentials
        key: db_password      # key is 'password' in the Secret, not 'db_password'


# CORRECT
env:
  - name: DB_PASSWORD
    valueFrom:
      secretKeyRef:
        name: db-credentials
        key: password
Step 5: Audit Liveness and Readiness Probes
Misconfigured probes are a silent killer. A liveness probe with too short an initialDelaySeconds will kill your container before it has finished booting — especially Java applications or anything that connects to a database at startup.
# Deliberately bad probe config (initialDelay too short for a JVM app)
livenessProbe:
  httpGet:
    path: /health
    port: 8080
  initialDelaySeconds: 5    # JVM apps often need 30-60s to boot
  periodSeconds: 10
  failureThreshold: 3


# More reasonable probe config
livenessProbe:
  httpGet:
    path: /health
    port: 8080
  initialDelaySeconds: 45
  periodSeconds: 15
  failureThreshold: 3
  timeoutSeconds: 5
Probe failures show up clearly in kubectl describe pod output under Events as Liveness probe failed or Readiness probe failed.
Step 6: Check Init Containers
If your pod uses init containers, they must all complete successfully before the main container starts. A failed init container will keep the main container from running and eventually surface as CrashLoopBackOff.
# Check init container status
$ kubectl get pod payment-service-7d9f4b6c8-xk2mp -n prod -o jsonpath='{.status.initContainerStatuses}'


# Get init container logs
$ kubectl logs payment-service-7d9f4b6c8-xk2mp -n prod -c db-migration --previous
Advanced Insights
When NOT to Restart the Pod
The instinct when you see CrashLoopBackOff is to delete the pod and hope it comes back clean. Resist this. Deleting the pod destroys the only evidence you have — specifically:
- The previous container logs (–previous flag will return nothing after a new pod starts)
- The exact event history tied to this pod UID
- The resource usage snapshot at the time of failure
Do your diagnostics first. Only delete the pod after you have extracted all the information you need and confirmed the fix.
| Exception: If the crashing pod is consuming node resources aggressively or blocking other workloads, cordon the node and drain non-critical pods before investigating. |
OOM Kills That Look Like Application Crashes
One subtle production issue: some runtimes (Go, Python) catch SIGKILL and print a partial log before dying. You might see a log line that looks like a normal shutdown, but the exit code is 137. Always check the exit code, not just the last log line.
Also watch for container memory limits that are set correctly but with a JVM Xmx that does not account for off-heap memory (metaspace, native threads, code cache). The JVM heap can be within limit while total process memory blows past it.
# Correct JVM memory config for a container with 512Mi limit
# Leave ~150Mi headroom for off-heap
env:
  - name: JAVA_OPTS
    value: "-Xms256m -Xmx340m -XX:MaxMetaspaceSize=128m"
Config Errors Disguised as Application Errors
When an application fails to parse a config file and prints a generic error like failed to start or configuration error, the actual YAML or JSON parsing error is usually on the line above. Read the full log, not just the last line. Better yet, set up structured logging so config validation errors have a specific log level and key.
Quick Reference: Cause and Fix
| Cause | Signal | Fix |
|---|---|---|
| OOM Kill | Exit 137, OOMKilled in events | Increase memory limit or fix memory leak |
| Bad env var / secret | App log: key not found, nil pointer | Correct secretKeyRef key name or mount |
| Probe too aggressive | Liveness probe failed in events | Increase initialDelaySeconds |
| App startup crash | Stack trace in previous logs | Fix the application bug |
| Init container failure | Init container status not Running | Debug init container logs |
| Wrong entrypoint | Exit 127, exec not found | Fix Dockerfile CMD or YAML command field |
Prevention Strategies
Set Resource Limits Based on Profiling, Not Guesses
Run your workload under realistic load using a staging environment and capture actual memory and CPU usage. Set limits at 1.25x to 1.5x your p99 usage, not at arbitrary round numbers like 512Mi or 1Gi. Use Vertical Pod Autoscaler in recommendation mode to get data-driven suggestions.
Enforce Startup Validation in Your Application
Your application should validate all required config on startup and exit with a descriptive error message (and exit code 1) if anything is missing. This makes CrashLoopBackOff debugging take 30 seconds instead of 30 minutes. Example:
// Go example: fail fast with a clear message
dbURL := os.Getenv("DATABASE_URL")
if dbURL == "" {
    log.Fatal("DATABASE_URL is required but not set")
}
Use Pod Disruption Budgets and Rolling Update Strategies
Configure RollingUpdate strategy with maxUnavailable: 0 and maxSurge: 1 for critical services. This ensures the old pods stay up until new pods are proven healthy, which prevents a bad deployment from taking down all replicas at once.
strategy:
  type: RollingUpdate
  rollingUpdate:
    maxUnavailable: 0
    maxSurge: 1
Add Alerting on Restart Count, Not Just CrashLoopBackOff
By the time Kubernetes shows CrashLoopBackOff, the pod has already restarted multiple times. A Prometheus alert on kube_pod_container_status_restarts_total increasing more than twice in five minutes catches problems earlier, before the backoff delay starts masking the frequency of failures.
Common Mistakes Engineers Make
- Reading current logs instead of –previous logs — you miss the actual crash
- Increasing memory limits without confirming OOM is the actual cause
- Deleting pods immediately, destroying the event history
- Setting initialDelaySeconds to match local startup time, not production (JVM apps are slower under load)
- Using the same probe endpoint for both liveness and readiness — they serve different purposes
- Assuming the last deployment caused the crash — sometimes it is an upstream dependency that changed
Pro Tips from Production
Tip 1: Use a Debug Sidecar for Hard-to-Reproduce Crashes
If the crash is intermittent and you cannot reproduce it consistently, add an ephemeral debug container to the running pod without restarting it:
$ kubectl debug -it payment-service-7d9f4b6c8-xk2mp \
    --image=busybox --target=payment-service -n prod
Tip 2: Correlate Pod Restarts with Deployment Events
Cross-reference the pod restart timestamps with recent Helm releases or kubectl rollout history to identify whether a config change or image change triggered the issue:
$ kubectl rollout history deployment/payment-service -n prod
$ kubectl rollout undo deployment/payment-service -n prod  # rollback if needed
Tip 3: Watch Events in Real Time During a Fix
$ kubectl get events -n prod --watch --field-selector involvedObject.name=payment-service-7d9f4b6c8-xk2mpFAQ
Can CrashLoopBackOff be caused by a Node issue, not a pod issue?
Yes. If a node is under severe memory or CPU pressure, the kubelet may OOM-kill processes including containers, or the container runtime itself may behave erratically. kubectl describe node will show memory pressure conditions. Check if all crashing pods are on the same node.
How long does Kubernetes wait before the next restart?
The backoff schedule is: 10s, 20s, 40s, 80s, 160s, then capped at 300s (5 minutes). The timer resets after a pod runs continuously for 10 minutes.
Why does kubectl logs –previous sometimes return nothing?
If the pod was deleted and a new pod was scheduled (new pod name, new UID), the previous container logs from the old pod are gone. This is why you should always check logs before deleting pods. If you are using a centralized logging system (Loki, Elasticsearch, Datadog), query it with the old pod name.
Should I use restartPolicy: Never to debug CrashLoopBackOff?
In a non-production debugging scenario, yes. Setting restartPolicy: Never on a standalone pod means it stays in Failed state after crashing, giving you time to inspect logs and environment. Never do this in production — your Deployment controller will just create new pods anyway.
Conclusion
CrashLoopBackOff is not a bug — it is a breadcrumb trail. The container failed, Kubernetes recorded why, and the information is there waiting for you in the exit codes, events, and previous logs. The engineers who resolve these incidents quickly are the ones who follow a systematic debugging process instead of restarting pods and hoping for the best.
Start with kubectl describe. Pull previous logs. Check exit codes. Validate config. Audit probes. That five-step sequence will resolve 90% of CrashLoopBackOff incidents you encounter in production — usually within 15 minutes of the alert firing.
Prevention is the longer game: enforce startup validation in your applications, set resource limits based on real profiling data, and alert on restart count before it escalates into a full CrashLoopBackOff.
| The best time to debug CrashLoopBackOff is before it happens — add restart-rate alerts, enforce resource limits, and validate configs in CI. |
If you like this article or have any questions, then do comment below and let us know your questions. I will be happy to answer it. If you want to read more such useful devops and kubernetes related then do visit https://pratikshinde.online/
Pratik Shinde
Pratik Shinde is a DevOps and Cloud professional based in Pune, Maharashtra, India, with hands-on experience in building and managing scalable systems. Working in top multinational Organization as Devops Engineer with experience of 10+ years. He has a strong working background in DevOps, Kubernetes, and cloud platforms, along with practical exposure to artificial intelligence and machine learning concepts. He also shares knowledge and learning resources on platforms like LinkedIn and other social channels, aiming to simplify complex topics and make them accessible to a wider audience. Linkedin URL: https://www.linkedin.com/in/pratikshinde8494/ . Github URL: https://github.com/PratikShindeGithub