With Real-World Production Examples
A deep-dive guide for DevOps engineers, SREs, and backend engineers running Kubernetes in production.
Introduction: The Part of Kubernetes Nobody Teaches You
Every Kubernetes tutorial shows you how to deploy a pod. Almost none of them show you what happens after kubectl apply runs and that gap is exactly why engineers get paged at 2 AM staring at a pod stuck in Pending, Terminating, or ContainerCreating for 40 minutes with no clear explanation.
The pod lifecycle is not just a sequence of phases to memorize. It is a state machine, and every transition in that machine has failure modes. I have spent over two decades running production workloads, and the engineers who resolve cluster incidents fastest are consistently the ones who have internalized what Kubernetes is doing at each phase — not the ones who can recite the phases in order.
This guide walks through the full lifecycle with real-world failure scenarios, the exact kubectl commands to inspect each phase, and the fixes that actually work under production pressure.
How the Kubernetes Pod Lifecycle Actually Works
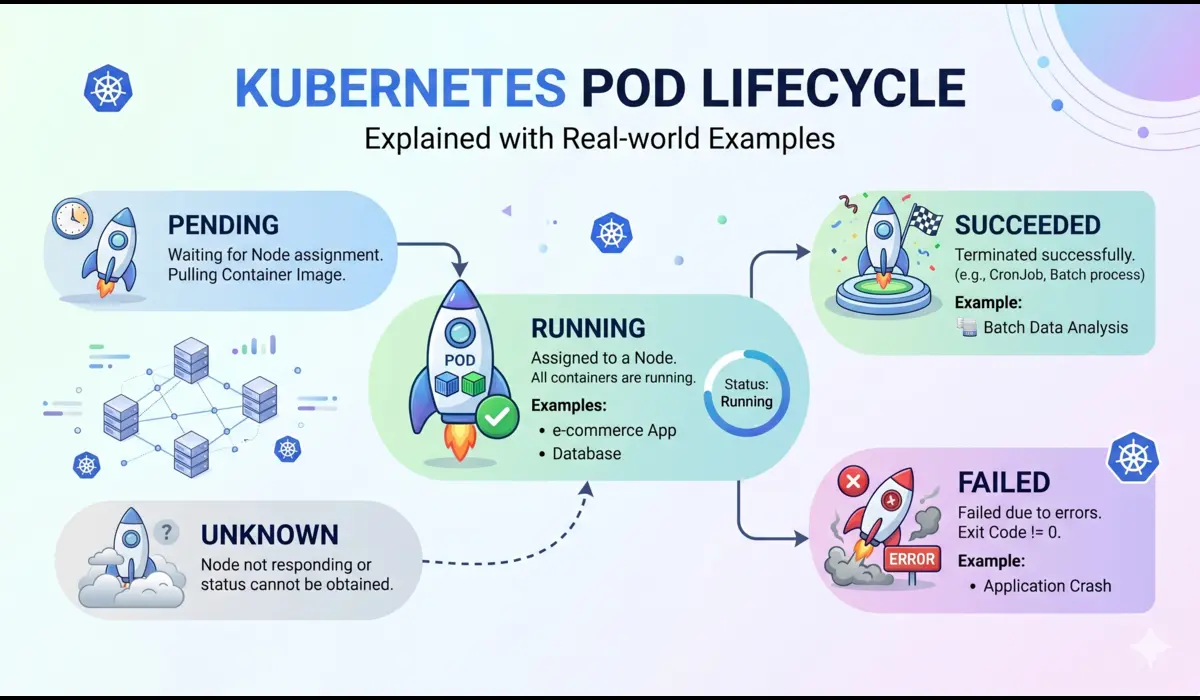
A pod moves through a sequence of phases from the moment it is created to the moment it is gone. The official phases are: Pending, Running, Succeeded, Failed, and Unknown. But what happens between those phases matters far more than the phases themselves.
Phase 1: Pending
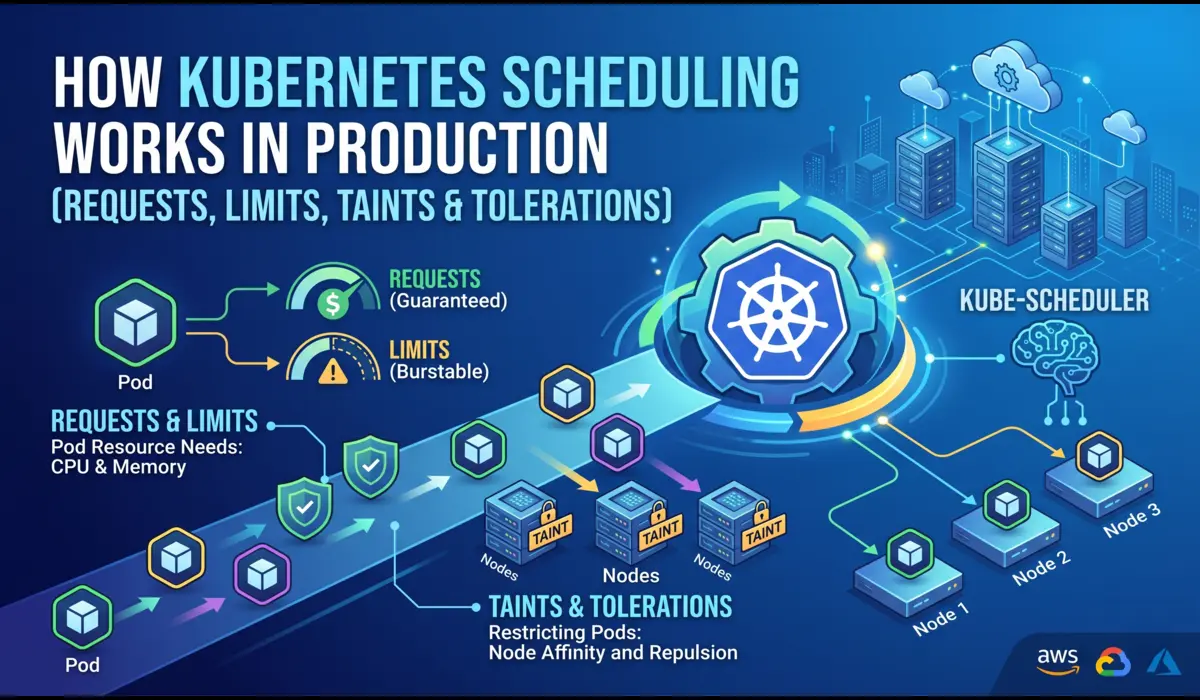
When you submit a pod to the API server, it lands in Pending. What happens next depends on the scheduler. The scheduler evaluates every node against the pod’s resource requests, node selectors, affinity rules, and tolerations. If no node satisfies the constraints, the pod stays in Pending indefinitely, it does not error out.
A pod stuck in Pending is almost always one of three things:
- No node has enough unallocated CPU or memory to satisfy the resource requests
- A node selector or affinity rule does not match any available node
- A required PersistentVolumeClaim has not been bound
Check this with:
# Fastest way to see why a pod is stuck in Pending
$ kubectl describe pod <pod-name> -n <namespace>


# Look for Events section at the bottom — example output:
Events:
  Warning  FailedScheduling  45s  default-scheduler
    0/6 nodes are available: 3 Insufficient memory, 3 node(s) had untolerated taint.
📌 The scheduler does not retry immediately. It re-evaluates when cluster state changes a new node joins, a pod is evicted, or resources are freed. If nothing changes, the pod waits forever.
Phase 2: The Gap Between Pending and Running
This is the phase that confuses the most engineers because kubectl does not surface it cleanly. After scheduling, the kubelet on the assigned node takes over and executes a precise sequence before your container ever starts:
- Pull the container image (if not already cached on the node)
- Run all Init containers in order, each must complete with exit code 0 before the next starts
- Set up volumes, mount ConfigMaps, Secrets, PVCs, and emptyDir volumes into the container filesystem
- Apply security context, set UID/GID, capabilities, read-only root filesystem if configured
- Start the main container
During image pull, the pod shows ContainerCreating. This is where a bad image tag, a private registry without proper imagePullSecret, or a large image on a slow node causes multi-minute delays that look like the cluster is hung.
# See what the kubelet is actually doing
$ kubectl get events -n <namespace> --sort-by=.lastTimestamp


# Check image pull status specifically
$ kubectl describe pod <pod-name> -n <namespace> | grep -A10 'Events'


# Example: missing imagePullSecret
Warning  Failed  12s  kubelet  Failed to pull image
  "registry.company.com/api:v2.1.0": rpc error:
  code = Unknown desc = failed to pull and unpack image:
  unauthorized: authentication required
Phase 3: Running
A pod enters Running when at least one container has started. This does not mean your application is healthy or even that it is accepting traffic. It means the container process is alive. This distinction matters enormously in production.
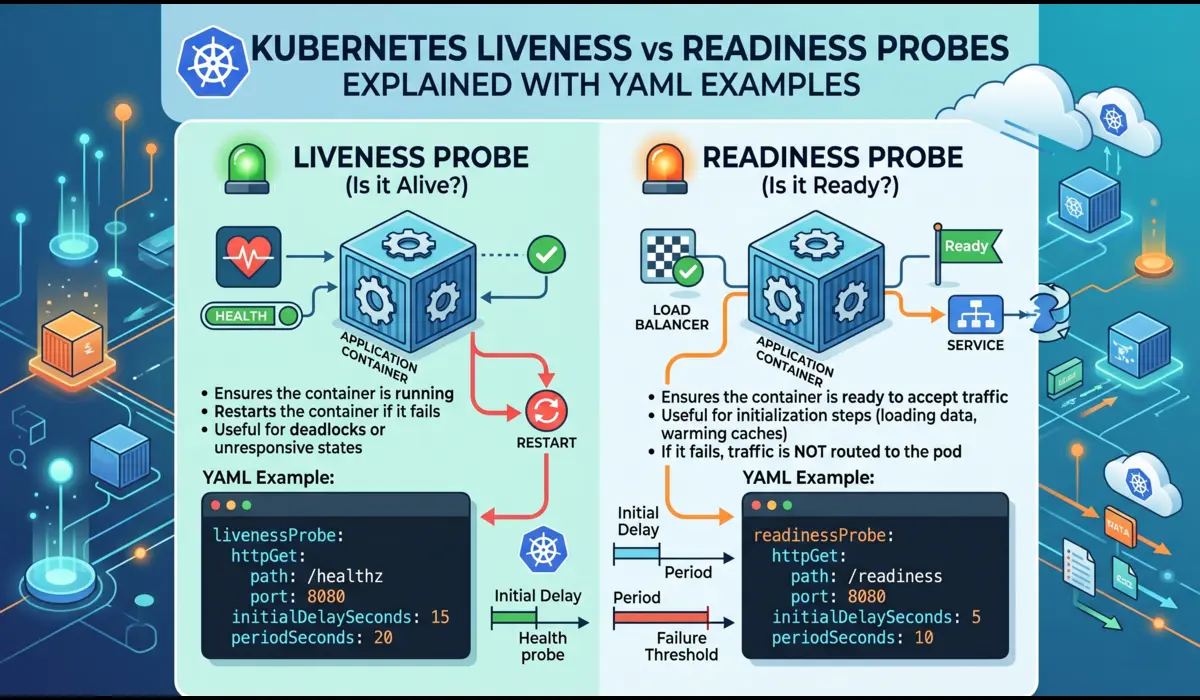
Readiness probes control whether a pod receives traffic from a Service. A pod in Running state with a failing readiness probe is excluded from the Endpoints list, requests will not reach it. Liveness probes control whether the kubelet restarts the container.
A misconfigured probe causes real production incidents. The two most common:
- initialDelaySeconds too short: the probe fires before the application finishes startup, the container gets killed and restarted, and you get CrashLoopBackOff
- Same endpoint for both liveness and readiness: a database dependency going down marks the pod not-ready AND triggers a container restart — when you actually want the pod to stop receiving traffic but not be killed
# Good probe configuration for a JVM-based microservice
livenessProbe:
  httpGet:
    path: /internal/health/live
    port: 8080
  initialDelaySeconds: 60   # JVM startup under load takes longer than local
  periodSeconds: 15
  failureThreshold: 3
  timeoutSeconds: 5


readinessProbe:
  httpGet:
    path: /internal/health/ready   # Different endpoint — checks DB, cache
    port: 8080
  initialDelaySeconds: 30
  periodSeconds: 10
  failureThreshold: 2
Phase 4: Termination — Where Most Engineers Get It Wrong
Pod termination is a coordinated shutdown sequence, not a kill command. When you delete a pod — or a rolling update evicts it, the following happens in parallel:
- The pod is removed from the Service Endpoints list (traffic stops routing to it)
- Kubernetes sends SIGTERM to PID 1 in each container
- A countdown starts: terminationGracePeriodSeconds (default: 30 seconds)
- After the grace period, SIGKILL is sent regardless
The trap: the Endpoints removal and the SIGTERM are triggered simultaneously, not sequentially. At scale, kube-proxy and CNI plugins take a few seconds to propagate the Endpoints change across the cluster. During that propagation window, new requests can still arrive at a container that has already begun shutting down.
The production fix is a preStop hook that adds a short sleep before your application starts shutting down:
lifecycle:
  preStop:
    exec:
      command: ["/bin/sleep", "5"]


# Combined with graceful shutdown in your app — Go example:
# srv := &http.Server{...}
# quit := make(chan os.Signal, 1)
# signal.Notify(quit, syscall.SIGTERM)
# <-quit
# ctx, cancel := context.WithTimeout(context.Background(), 25*time.Second)
# defer cancel()
# srv.Shutdown(ctx)
📌 Set terminationGracePeriodSeconds to at least 5 seconds more than your longest p99 request duration. For databases or message consumers, you may need 60-120 seconds.
Real Production Issues and How to Debug Them
Issue 1: Pods Stuck in Terminating for Hours
You run kubectl delete pod and the pod stays in Terminating state indefinitely. The application shut down fine, but the pod refuses to disappear. This happens most often when:
- A finalizer is set on the pod and the controller responsible for removing it is not running or is stuck
- A mounted volume has a detach operation that is stuck (common with EBS volumes and node failures)
- The node is unreachable and the API server is waiting for the kubelet to confirm termination.
# Check for finalizers
$ kubectl get pod <pod-name> -n <namespace> -o jsonpath='{.metadata.finalizers}'


# Force-remove a stuck pod (last resort — skip graceful shutdown)
$ kubectl delete pod <pod-name> -n <namespace> --grace-period=0 --force


# Check if the node is unreachable (pod may be in Unknown state)
$ kubectl get nodes
$ kubectl describe node <node-name> | grep -A5 'Conditions'
Issue 2: Init Container Loops Blocking Main Container
An init container that runs a database migration can loop indefinitely if it cannot reach the database. The main container never starts. Engineers often miss this because kubectl get pods shows Init:0/1 which looks innocuous, but the pod has been in that state for 20 minutes.
# Check init container status in detail
$ kubectl get pod <pod-name> -n <namespace> -o jsonpath='{.status.initContainerStatuses}'


# Get logs from a specific init container
$ kubectl logs <pod-name> -n <namespace> -c db-migration


# If the init container has already exited, use --previous
$ kubectl logs <pod-name> -n <namespace> -c db-migration --previous
The fix in most cases is a retry loop inside the init container rather than relying on Kubernetes to restart it. A simple shell script that retries the database connection check every 5 seconds is more resilient than letting Kubernetes backoff logic handle it.
Issue 3: Pod Eviction During Node Pressure
When a node runs low on memory or disk, the kubelet starts evicting pods. The eviction order is determined by Quality of Service class: BestEffort pods (no requests/limits) are evicted first, then Burstable, then Guaranteed. If you see pods being randomly killed and the node shows memory pressure, this is your culprit.
# Check node memory and disk pressure
$ kubectl describe node <node-name> | grep -A10 'Conditions'


# See which pods are BestEffort (most eviction risk)
$ kubectl get pods -n <namespace> -o json | jq '.items[] |
  select(.status.qosClass == "BestEffort") | .metadata.name'


# Check recent eviction events
$ kubectl get events -n <namespace> | grep Evicted
Step-by-Step: Debugging a Pod Stuck in Any Phase
This sequence works for any lifecycle issue regardless of phase:
- Step 1: Run kubectl describe pod — read the Events section completely, not just the top
- Step 2: Check kubectl get events sorted by timestamp — events may reference objects other than the pod
- Step 3: For ContainerCreating: check image pull, volume mount, and init container status
- Step 4: For Running with issues: check probe configuration and check –previous logs
- Step 5: For Terminating: check finalizers and node health
- Step 6: Cross-reference with node-level info using kubectl describe node
# Complete diagnostic sequence
NAMESPACE=production
POD=api-server-7d9f4b6c8-xk2mp

# 1. Overview
kubectl get pod $POD -n $NAMESPACE -o wide

# 2. Full details including events
kubectl describe pod $POD -n $NAMESPACE

# 3. Previous container logs
kubectl logs $POD -n $NAMESPACE --previous --tail=100

# 4. Live log stream
kubectl logs $POD -n $NAMESPACE -f

# 5. Resource usage
kubectl top pod $POD -n $NAMESPACE --containers
Quick Reference: Phase Signals and Fixes
| Phase / State | Signal to Check | Common Cause | Fix |
| Pending | kubectl describe Events | Insufficient resources or taint mismatch | Scale nodes or fix affinity rules |
| ContainerCreating | Image pull events | Wrong image tag or missing imagePullSecret | Fix registry credentials or image reference |
| Init:0/N | Init container logs | DB not reachable, migration failed | Add retry logic in init container |
| CrashLoopBackOff | Exit code + previous logs | App crash, bad env var, probe too aggressive | See CrashLoopBackOff guide, fix root cause |
| Running (no traffic) | Endpoints list | Readiness probe failing | Fix probe endpoint or increase initialDelaySeconds |
| Terminating (stuck) | Finalizers, node status | Finalizer not cleared or node unreachable | Check controller or force delete |
| Unknown | Node conditions | Node lost contact with API server | Investigate node network or kubelet status |
Common Mistakes
Confusing Readiness and Liveness Probes
They serve fundamentally different purposes. Liveness tells Kubernetes whether to restart the container. Readiness tells Kubernetes whether to send traffic to it. Using the same endpoint and same thresholds for both means a downstream dependency failure triggers container restarts and adding instability to what should be a graceful degradation.
Ignoring Quality of Service Classes
Setting memory limits without setting matching requests makes your pod Burstable and vulnerable to eviction during node pressure. For critical services, set requests equal to limits to get Guaranteed QoS. This costs more in cluster overhead but eliminates eviction risk.
Not Handling SIGTERM in the Application
The default behavior for most runtimes when receiving SIGTERM is to exit immediately. If your application has in-flight requests, queued messages, or open database transactions, they get dropped. Every production service should catch SIGTERM and complete in-flight work before exiting.
Setting terminationGracePeriodSeconds Below Application Drain Time
If your app needs 45 seconds to drain connections but your grace period is 30 seconds, Kubernetes sends SIGKILL before draining completes every time. Measure your actual drain time under load, then set the grace period to cover it with headroom.
Pro Tips from Production
Use startupProbe for Slow-Starting Containers
startupProbe was added specifically for applications with unpredictable startup times. While it is succeeding, liveness and readiness probes are disabled. This is cleaner than inflating initialDelaySeconds on the liveness probe:
startupProbe:
  httpGet:
    path: /health
    port: 8080
  failureThreshold: 30   # 30 * 10s = 5 minutes maximum startup window
  periodSeconds: 10
Watch Pod Lifecycle Events in Real Time During Deployments
# Watch all events in a namespace during a rolling deployment
$ kubectl get events -n production --watch


# Watch pod status changes across the deployment
$ kubectl get pods -n production -l app=api-server --watch
Use Pod Disruption Budgets to Prevent Cascade Failures During Termination
A PodDisruptionBudget ensures that voluntary disruptions (rolling updates, node drains) do not take down more replicas than you can tolerate:
apiVersion: policy/v1
kind: PodDisruptionBudget
metadata:
  name: api-server-pdb
  namespace: production
spec:
  minAvailable: 2       # At least 2 pods must be Running and Ready
  selector:
    matchLabels:
      app: api-server
FAQ
Why does a pod show Running but my application is not serving requests?
Running means the container process is alive, not that the application is healthy. Check whether the readiness probe is passing with kubectl describe pod and look for Readiness probe failed events. If the pod is not Ready, it will not receive traffic from any Service regardless of its Running status.
How do I tell if a pod was OOM-killed versus crashing on its own?
kubectl describe pod will show OOMKilled as the reason in the Last State section, along with exit code 137. A normal application crash shows exit code 1 (or whatever code the app exits with). Do not rely on log output alone or some runtimes print partial logs before being killed pod.
Is it safe to force-delete a pod that is stuck in Terminating?
It removes the pod object from the API server, but the container on the node may still be running until the kubelet catches up. If the node is healthy and reachable, the kubelet will clean up. If the node is unreachable, force deletion can leave ghost containers that you will need to clean up manually when the node recovers. Use it when you understand the trade-off.
What is the difference between a pod in Failed state versus CrashLoopBackOff?
Failed is a terminal state for pods with restartPolicy: Never or OnFailure after the failure condition is met. CrashLoopBackOff is not a pod phase. It is a condition that shows up in the STATUS column when a pod keeps restarting. The underlying phase is still Running (the container keeps getting restarted), but the exponential backoff is visible in the status.
Conclusion
Understanding the Kubernetes pod lifecycle at this level of detail changes how you respond to incidents. Instead of restarting pods and hoping for the best, you read the signals and the phase, the events, the exit codes, the probe status, and you know within minutes which part of the lifecycle is broken and why.
The patterns that cause production incidents repeat: probes misconfigured for JVM startup times, init containers with no retry logic, missing SIGTERM handlers, grace periods shorter than drain time, and pods scheduled without resource requests. None of these are exotic edge cases. They happen on virtually every team running Kubernetes at scale.
Build the discipline of checking kubectl describe before anything else, and teach your team the difference between Running and Ready. Those two habits alone will cut your mean time to resolution on pod incidents significantly.
Written from production experience running Kubernetes clusters at scale across multiple organizations.
You can also read: How to Debug Kubernetes Networking Issues
Pratik Shinde
Pratik Shinde is a DevOps and Cloud professional based in Pune, Maharashtra, India, with hands-on experience in building and managing scalable systems. Working in top multinational Organization as Devops Engineer with experience of 10+ years. He has a strong working background in DevOps, Kubernetes, and cloud platforms, along with practical exposure to artificial intelligence and machine learning concepts. He also shares knowledge and learning resources on platforms like LinkedIn and other social channels, aiming to simplify complex topics and make them accessible to a wider audience. Linkedin URL: https://www.linkedin.com/in/pratikshinde8494/ . Github URL: https://github.com/PratikShindeGithub