A Production Troubleshooting Guide for Senior DevOps and SRE Engineers
When Probes Go Wrong, Production Pays the Price
During a routine deployment on one of our EKS clusters last year, a Java microservice started throwing CrashLoopBackOff on every new pod. The rollout was stuck. No application logs pointed to any obvious crash. Three engineers stared at it for twenty minutes before someone finally ran kubectl describe pod and noticed a single line buried in the Events section:
Liveness probe failed: HTTP probe failed with statuscode: 503
Back-off restarting failed container
The liveness probe was hitting /health with an initialDelaySeconds of 10. The app — a Spring Boot service connecting to RDS at startup — needed closer to 45 seconds just to finish its database connection pool initialization. Kubernetes was killing it before it had a chance to start.
That kind of misconfiguration is completely avoidable. But it keeps happening because engineers copy-paste probe configs from docs without understanding what kubelet actually does with them — and more importantly, how liveness and readiness serve completely different purposes.
If you have ever wondered why your pod is restarting every two minutes with no obvious crash, or why traffic is hitting pods that are not ready yet — this guide covers the exact mechanics, real YAML, and production debugging steps.
A Quick Grounding Before We Get Into Mechanics
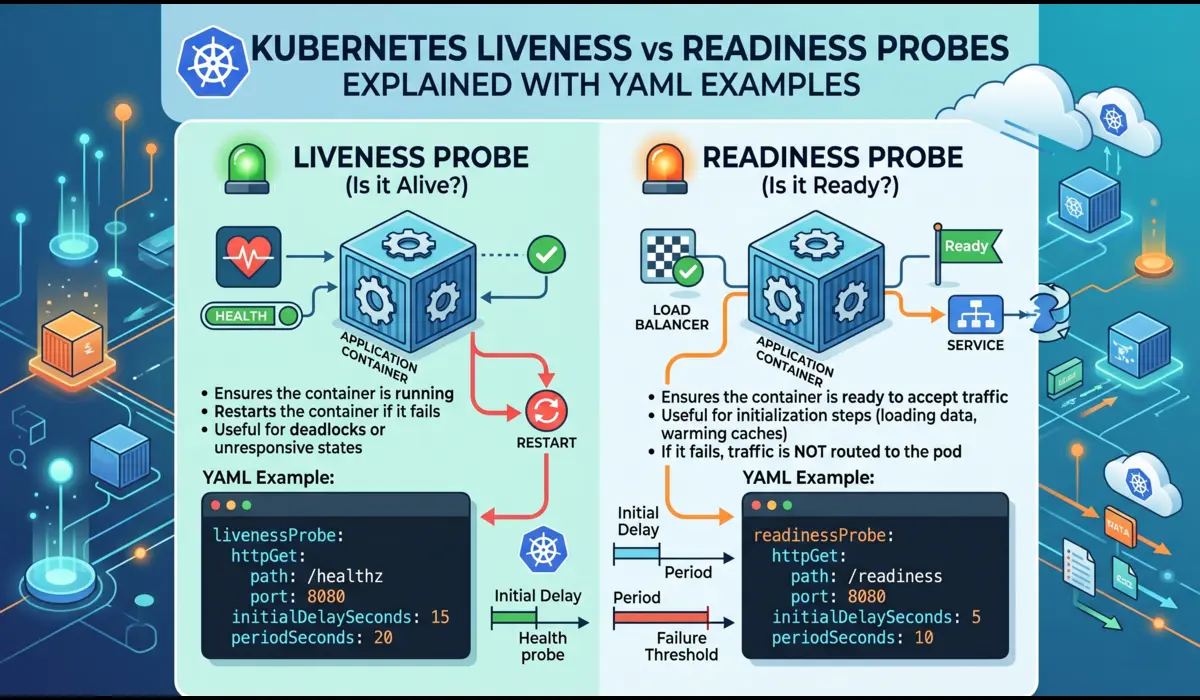
Liveness probes answer one question: is this container still alive? If the probe fails repeatedly, kubelet restarts the container. The intent is to recover from a stuck or deadlocked process that cannot recover on its own — a goroutine leak, a frozen thread pool, a hung database connection that will never time out.
Readiness probes answer a different question: is this container ready to receive traffic? If the probe fails, Kubernetes removes the pod from the Service endpoints list. The container keeps running — it is not restarted — but no new requests are routed to it until it passes again.
That distinction sounds simple. The problems begin when engineers treat them as interchangeable, or skip readiness probes entirely because the app usually starts fast enough in local dev.
Key Differences — Behavior, Not Definitions
The table below is how I explain this difference to engineers who are newer to Kubernetes. The focus is on consequences, not on the abstract definition.
| Aspect | Liveness Probe | Readiness Probe |
|---|---|---|
| Failure action | kubelet restarts the container | Pod removed from Service endpoints |
| Container state after failure | Killed and restarted | Still running, just not receiving traffic |
| Use case | Detect deadlocks, stuck processes | Graceful startup, drain before shutdown |
| Missing probe impact | Stuck containers never recover without human intervention | Traffic hits pods before they are ready — 502/503 errors |
| Probe fail = bad deployment? | Not directly — but it causes restarts | Yes — rolling updates wait for readiness |
| Risk of misconfiguration | HIGH — can cause unnecessary CrashLoopBackOff | MEDIUM — missing it causes cold-start errors |
The most dangerous configuration: using the same endpoint and the same timing for both liveness and readiness. They serve different purposes and should almost never be identical.
YAML Examples — Real Configurations That Actually Work
HTTP Liveness Probe
The HTTP probe is the most common type. kubelet sends an HTTP GET to the specified path and port. Any response in the 200–399 range is treated as success.
livenessProbe:
  httpGet:
    path: /healthz          # dedicated liveness endpoint, not /health or /ready
    port: 8080
    httpHeaders:             # optional: send custom headers if needed
      - name: X-Health-Check
        value: kubelet
  initialDelaySeconds: 30    # wait before first probe; tune per app startup time
  periodSeconds: 15          # how often kubelet runs the probe
  failureThreshold: 3        # consecutive failures before restart
  successThreshold: 1        # one success clears failure state (must be 1 for liveness)
timeoutSeconds: 5 # probe call timeoutinitialDelaySeconds: This is the field most engineers get wrong. It must be long enough that your application has fully initialized before the first probe runs. For JVM-based services, 30–60 seconds is typical. For Go or Node apps, 10–15 seconds is usually sufficient.
failureThreshold: Three consecutive failures before a restart is a sensible default. If your health endpoint is occasionally slow, consider increasing this rather than inflating timeoutSeconds, which has cluster-wide implications.
successThreshold: For liveness, this must always be 1. A value higher than 1 on a liveness probe is invalid and will be rejected by the API server.
HTTP Readiness Probe
Readiness probes are often more lenient in their timing because a failed readiness probe is lower stakes than a failed liveness probe — it just removes the pod from load balancing, not restarts it.
readinessProbe:
  httpGet:
    path: /ready             # separate from liveness endpoint
    port: 8080
  initialDelaySeconds: 10    # can be shorter than liveness
  periodSeconds: 5           # check more frequently during startup
  failureThreshold: 3
  successThreshold: 1
  timeoutSeconds: 3
The /ready endpoint in your application should be more thorough than /healthz. It should verify that the app has finished loading its config, established its database connection, warmed its caches — anything required before the app can meaningfully handle traffic. /healthz just needs to confirm the process is alive.
Combined Deployment — Both Probes Side by Side
Here is a realistic production deployment spec with both probes configured for a Java service running on EKS:
apiVersion: apps/v1
kind: Deployment
metadata:
  name: payment-service
  namespace: prod
spec:
  replicas: 3
  selector:
    matchLabels:
      app: payment-service
  strategy:
    type: RollingUpdate
    rollingUpdate:
      maxUnavailable: 0
      maxSurge: 1
  template:
    metadata:
      labels:
        app: payment-service
    spec:
      containers:
        - name: payment-service
          image: myrepo/payment-service:v2.4.1
          ports:
            - containerPort: 8080
          resources:
            requests:
              memory: "256Mi"
              cpu: "250m"
            limits:
              memory: "512Mi"
              cpu: "500m"
          livenessProbe:
            httpGet:
              path: /healthz
              port: 8080
            initialDelaySeconds: 45
            periodSeconds: 20
            failureThreshold: 3
            timeoutSeconds: 5
          readinessProbe:
            httpGet:
              path: /ready
              port: 8080
            initialDelaySeconds: 15
            periodSeconds: 5
            failureThreshold: 3
            successThreshold: 2
            timeoutSeconds: 3
Note successThreshold: 2 on the readiness probe. This means the pod must pass two consecutive readiness checks before receiving traffic again after a failure. Useful for flaky services to prevent oscillation in the endpoints list.
TCP Probe
TCP probes are useful when your application does not expose an HTTP endpoint — common in gRPC services, databases, or message brokers running inside a Kubernetes cluster.
livenessProbe:
  tcpSocket:
    port: 5432             # postgres port — kubelet attempts TCP connection
  initialDelaySeconds: 20
  periodSeconds: 15
  failureThreshold: 3
kubelet tries to open a TCP connection to that port. If the connection is accepted, the probe succeeds. If the port is not listening (or the connection is refused), the probe fails. This does not check anything about application state — just whether the port is open.
Exec Probe
The exec probe runs a command inside the container and uses the exit code to determine health. Exit code 0 = success. Anything else = failure. This is useful for applications that expose health through a custom CLI or when you want to check file existence or internal state.
livenessProbe:
  exec:
    command:
      - sh
      - -c
      - "redis-cli ping | grep -q PONG"  # only succeeds if Redis responds PONG
  initialDelaySeconds: 15
  periodSeconds: 10
  failureThreshold: 3
  timeoutSeconds: 5
Exec probes have overhead. Each probe run spawns a new process inside the container. On high-frequency probes (periodSeconds: 5) across hundreds of pods, this CPU cost adds up. Prefer HTTP probes wherever possible.
How Kubernetes Uses These Probes Internally
The Role of kubelet
kubelet — the node agent — runs probes, not the control plane. The API server and scheduler are not involved after a pod is scheduled. This is an important distinction: probe failures are a node-level decision, not cluster-level.
For each container with a defined probe, kubelet spawns a goroutine that periodically:
- Runs the configured probe type (HTTP, TCP, or exec)
- Checks the result against successThreshold and failureThreshold
- Updates the pod’s condition status in the kubelet’s in-memory state
- Reports the condition back to the API server, which updates the pod object
What Happens When Liveness Fails
When liveness fails failureThreshold consecutive times, kubelet sends SIGTERM to the container process. If the container does not exit within terminationGracePeriodSeconds (default: 30), kubelet sends SIGKILL. Then it restarts the container — same pod, same pod UID, but a new container. This is why kubectl logs –previous shows the previous container logs, and why RESTARTS increments in kubectl get pods.
The restart uses exponential backoff: 10s, 20s, 40s, 80s, 160s, capped at 300s. This backoff is what causes CrashLoopBackOff — kubelet is still trying to restart the container, just waiting longer each time.
What Happens When Readiness Fails
When readiness fails, kubelet sets the pod’s Ready condition to False. The Endpoints controller watches pod conditions. When it sees Ready = False, it removes the pod’s IP from the Endpoints object for all Services that select that pod.
No restart. No backoff. Traffic stops flowing to the pod, and the container continues running. When readiness passes again, the Endpoints controller adds the pod’s IP back.
# Watch endpoint changes in real time during a probe failure:
$ kubectl get endpoints payment-service -n prod -w

# Before readiness failure:
NAME              ENDPOINTS                                      AGE
payment-service   10.0.1.5:8080,10.0.1.7:8080,10.0.1.9:8080   3d

# During readiness failure on one pod:
payment-service   10.0.1.5:8080,10.0.1.9:8080                  3d
Common Mistakes — With Real Production Context
Mistake 1: Liveness Probe Kills Slow-Starting Apps
This is the most common mistake I see, especially on Java services. The default initialDelaySeconds in many examples is 10 or 15 seconds. A Spring Boot app connecting to a remote database under moderate load can take 45 to 90 seconds to start.
The symptom: the pod repeatedly enters CrashLoopBackOff with no crash-related application log. kubectl describe shows Liveness probe failed in Events. The container gets killed while still booting.
# Wrong: too short for a JVM service
livenessProbe:
  httpGet:
    path: /healthz
    port: 8080
  initialDelaySeconds: 10   # Spring Boot needs 45-90s under load
  failureThreshold: 3

# Better: give the JVM real startup room
livenessProbe:
  httpGet:
    path: /healthz
    port: 8080
  initialDelaySeconds: 60
  failureThreshold: 3
  periodSeconds: 20
In Kubernetes 1.18+, use startupProbe to handle slow-starting containers cleanly. The startup probe runs first and prevents liveness and readiness probes from starting until it succeeds, eliminating the initialDelaySeconds guessing game.
startupProbe:
  httpGet:
    path: /healthz
    port: 8080
  failureThreshold: 30       # 30 x periodSeconds = 5 min max startup window
  periodSeconds: 10
  # After this succeeds once, liveness/readiness take over
Mistake 2: No Readiness Probe on Services with Slow Initialization
Without a readiness probe, kubelet marks a pod Ready as soon as the container process starts. The Endpoints controller immediately adds the pod to the Service. Traffic flows to it before it can handle requests.
The symptom: intermittent 502 or 503 errors immediately after a deployment, then everything stabilizes. Your monitoring shows a spike in error rate that lasts exactly as long as the pod startup takes.
Fix: add a readiness probe that checks something meaningful — not just that the process is running, but that it has finished startup work. Database connectivity, cache warm-up, config loading — whatever your app needs before it can serve real traffic.
Mistake 3: Using the Same Endpoint for Both Probes
If /health returns 200 the moment the process starts, it works fine as a liveness target. But if the same endpoint is used for readiness and it does not reflect actual readiness state — database connectivity, downstream service availability — you will get traffic to pods that cannot actually serve it. Separate your endpoints: /healthz for liveness, /ready for readiness, and have your application return different status based on meaningful checks for each.
Mistake 4: Over-Aggressive periodSeconds on Exec Probes
A 5-second exec probe on a high-replica deployment can quietly destroy CPU headroom. Each probe spawns a new process. At periodSeconds: 5 across 50 replicas, you are spawning 600 processes per minute per node. On a constrained node, this is measurable.
# Bad: too frequent exec probe
livenessProbe:
  exec:
    command: ["sh", "-c", "custom-health-check.sh"]
  periodSeconds: 5           # 12 probes/min per container

# Better: less frequent, use HTTP instead if possible
livenessProbe:
  exec:
    command: ["sh", "-c", "custom-health-check.sh"]
  periodSeconds: 30          # 2 probes/min per container
Mistake 5: Probing the Wrong Port
This one is embarrassing when it happens but easy to do. Your app runs on port 8080 but the probe is pointed at port 80. The probe always succeeds because some other process on the node is listening on 80, or always fails because nothing is there. Check the actual containerPort in your deployment spec against the probe port.
Real-World Debugging Scenarios
Scenario 1: Liveness Probe Causing Repeated Restarts on EKS
What happened
A team deployed a new version of a Node.js API gateway to EKS. Within 5 minutes, all three pods were in CrashLoopBackOff. RESTARTS counter was at 4 and climbing. No code change had been made to the health endpoint — only the underlying express middleware was updated.
Commands used
# Step 1: describe pod to get full context
$ kubectl describe pod api-gateway-5d8b7f6c4-k9xmz -n prod

# Relevant section from output:
Containers:
  api-gateway:
    State:       Running
    Last State:  Terminated
      Reason:    Error
      Exit Code: 137
      ...
    Ready:  False
    Restart Count: 4

Events:
  Liveness probe failed: Get http://10.0.1.23:8080/healthz: context deadline exceeded

# Step 2: get previous container logs
$ kubectl logs api-gateway-5d8b7f6c4-k9xmz -n prod --previous --tail=50

# Logs showed normal startup with no errors, but ending prematurely

# Step 3: check timing values in the deployment
$ kubectl get deployment api-gateway -n prod -o yaml | grep -A15 livenessProbe
Root cause
The middleware update had added a synchronous database call inside the /healthz handler — the kind of thing that passes code review because it looks innocent. Under load, that DB call was taking 6-8 seconds. The probe’s timeoutSeconds was set to 2. Every probe timed out, accumulated three failures, and kubelet restarted the container. Exit code 137 came from kubelet sending SIGKILL after SIGTERM was not acted on fast enough.
Fix
# The health endpoint itself was fixed (removed the DB call from /healthz).
# The probe config was also tightened:

livenessProbe:
  httpGet:
    path: /healthz
    port: 8080
  initialDelaySeconds: 20
  periodSeconds: 15
  failureThreshold: 3
  timeoutSeconds: 8          # raised from 2 to 8 as a safety buffer
                             # while the code fix was rolled out
Scenario 2: Missing Readiness Probe Causing 503 Errors on GKE During Deployments
What happened
A Go microservice on GKE had no readiness probe defined. Deployments worked fine in staging. In production, every rollout triggered a 2-3 minute window of 503 errors from the upstream load balancer. The service was doing a large in-memory cache warm-up from Redis on startup — taking 40-60 seconds to be ready to serve real traffic.
How it was diagnosed
# Check if pod has any probes defined
$ kubectl get pod cache-service-6f9b4c7d2-p3nqs -n prod -o yaml | grep -A20 'livenessProbe\|readinessProbe'

# No output — no probes defined at all

# Confirm endpoints were immediately populated
$ kubectl describe endpoints cache-service -n prod
Subsets:
  Addresses: 10.0.1.8:9090,10.0.1.9:9090,10.0.1.11:9090   # all 3 new pods added immediately

# Check pod logs to understand startup time
$ kubectl logs cache-service-6f9b4c7d2-p3nqs -n prod | head -30
# Logs showed: 'Starting cache warm-up from Redis...'
# '... cache warm-up complete, accepting traffic' appeared 52 seconds later
Fix
readinessProbe:
  httpGet:
    path: /ready               # handler returns 503 until cache warm-up completes
    port: 9090
  initialDelaySeconds: 5
  periodSeconds: 5
  failureThreshold: 20        # 20 x 5s = 100s max wait (covers slow warm-up)
  successThreshold: 2
  timeoutSeconds: 3

livenessProbe:
  httpGet:
    path: /healthz             # separate endpoint, always returns 200 if process is up
    port: 9090
  initialDelaySeconds: 15
  periodSeconds: 20
  failureThreshold: 3
  timeoutSeconds: 5
After this change, rolling updates no longer produced 503 errors. The new pods stayed out of the Endpoints list until their cache was warm. The old pods continued handling traffic until the new ones were genuinely ready.
Best Practices — Practical, Not Boilerplate
Always use a startupProbe for slow-starting containers
Rather than inflating initialDelaySeconds on your liveness probe and hoping it is long enough, use a startupProbe with a high failureThreshold. Once startupProbe succeeds, liveness and readiness take over. This gives your container a generous startup window without permanently inflating the liveness timing.
Keep liveness endpoints lightweight
The /healthz endpoint should do nothing more than return 200. No database calls, no external checks. If your process is alive and responsive, return 200. If the liveness endpoint itself can fail due to downstream state, your liveness probe will restart containers for the wrong reasons.
Make readiness endpoints meaningful
The /ready endpoint should reflect actual readiness: database connected, required config loaded, downstream dependencies reachable (if your SLA depends on them). Return 503 until the app is genuinely ready. This is what protects you from cold-start traffic errors during deployments.
Tune timing based on profiling, not documentation defaults
Run your application under production-like load in staging and measure actual startup time. Set initialDelaySeconds to 1.5x your p99 startup time. Do not copy examples from the Kubernetes documentation directly — they are deliberately minimal.
Use separate /healthz and /ready endpoints
This is a hard rule in our runbooks. Using the same endpoint for both probes conflates two different questions and makes debugging harder. If a pod is removed from load balancing, you should be able to tell immediately whether it was a liveness issue (restart) or readiness issue (endpoint removal).
When NOT to use a liveness probe
If your application does not have a meaningful way to detect a stuck state — or if false positives from the probe are more likely than actual deadlocks — consider not adding a liveness probe at all. An unnecessary liveness probe that fires incorrectly is worse than no liveness probe. Readiness probes, on the other hand, are almost always worth adding.
Quick Reference: Probe Timing Defaults by Runtime
| Runtime | initialDelaySeconds | periodSeconds | failureThreshold | timeoutSeconds |
|---|---|---|---|---|
| Go / Node.js | 10–20s | 10–15s | 3 | 3–5s |
| Java / Spring Boot | 45–90s | 20s | 3 | 5–10s |
| Python / FastAPI | 10–20s | 10s | 3 | 3–5s |
| Rust / C++ | 5–10s | 10s | 3 | 3s |
These are starting points, not final values. Always profile your specific application under production-representative load before committing to probe timings in your deployment manifests.
FAQ
Can a pod be removed from Service endpoints without being restarted?
Yes. That is exactly what a failing readiness probe does. The container keeps running, logs keep flowing, but no new traffic is routed to it. It will be added back once the readiness probe passes again.
Does liveness probe affect rolling updates?
Not directly. The rolling update controller waits for readiness, not liveness. However, if a pod is in a liveness failure loop, it will never become Ready, which blocks the rolling update from progressing. So a misconfigured liveness probe on a new deployment can halt a rollout indefinitely.
Is it safe to use exec probes in production?
Yes, but with caution around periodSeconds. Keep exec probes infrequent (periodSeconds: 20 or higher) and make the command fast. Avoid exec probes on high-replica deployments unless the command is trivially fast and produces minimal I/O.
What is the difference between startupProbe and initialDelaySeconds?
initialDelaySeconds is a fixed wait before the first liveness or readiness probe runs. startupProbe is an active check that must succeed before other probes begin. startupProbe is more precise: it adapts to actual startup time rather than waiting a fixed period. Use startupProbe for any container where startup time is variable or potentially long.
Should I probe all containers in a multi-container pod?
Yes, if each container is independently responsible for serving traffic or maintaining critical state. Probes are configured per container, not per pod. If a sidecar handles important functionality — like an Envoy proxy managing mTLS — it should have its own readiness probe.
What happens if the probe endpoint returns a 404?
A 404 is treated as a failure. kubelet checks for HTTP status codes in the 200–399 range. 404 falls outside that range, so it counts as a probe failure. Make sure your health endpoint paths exist and return appropriate status codes.
Conclusion
Liveness and readiness probes are simple in concept but easy to misconfigure in ways that cause real production incidents — unnecessary restarts, traffic to unready pods, stalled rolling updates. The mental model that matters:
| Liveness Probe | Readiness Probe |
|---|---|
| Is this process alive? | Is this process ready for traffic? |
| Failure restarts the container | Failure removes from Service endpoints |
| /healthz — lightweight, always returns 200 if alive | /ready — checks actual readiness state |
| Use startupProbe for slow-starting apps | Always define this — skipping it causes cold-start errors |
The practical takeaway: always define a readiness probe. Be conservative with liveness probes — a false liveness failure that kills a healthy container is worse than no liveness probe at all. When you are debugging a probe-related incident, start with kubectl describe pod, read the Events section carefully, and pull previous container logs before touching any YAML.
The best time to tune probe values is before a deployment reaches production — run your app under realistic load in staging, measure actual startup time, and set timing values based on data rather than defaults.

Pratik Shinde
Pratik Shinde is a DevOps and Cloud professional based in Pune, Maharashtra, India, with hands-on experience in building and managing scalable systems. Working in top multinational Organization as Devops Engineer with experience of 10+ years. He has a strong working background in DevOps, Kubernetes, and cloud platforms, along with practical exposure to artificial intelligence and machine learning concepts. He also shares knowledge and learning resources on platforms like LinkedIn and other social channels, aiming to simplify complex topics and make them accessible to a wider audience. Linkedin URL: https://www.linkedin.com/in/pratikshinde8494/ . Github URL: https://github.com/PratikShindeGithub