A field-tested reference for diagnosing CPU spikes, memory leaks, network failures, and production outages — built from real incident experience.
Linux Troubleshooting DevOps Performance SRE.
It’s 2:47 AM. Your phone is going off. The on-call alert says: “API response time > 10s — 35% error rate.” You SSH into the server, and stare at a terminal. Where do you even start?
Every DevOps engineer has been there. The difference between a 10-minute recovery and a 2-hour war room isn’t luck — it’s having a systematic troubleshooting methodology burned into your muscle memory.
This guide isn’t a textbook. It’s what I actually do when production is on fire. It covers real commands, real scenarios, and the reasoning behind every step. Save it, print it, make it your runbook.
The Troubleshooting Guide Mindset: Start Broad, Then Narrow
Before running any command, take 30 seconds to think. What changed recently? Was there a deployment? A traffic spike? A cron job that runs at this hour? The answer to “what changed” resolves about 60% of production incidents in my experience — before you ever open top.
Then follow this sequence:
- Establish a baseline — Is this one server or all of them?
- Check system health at a glance — CPU, memory, disk, network.
- Identify the offending process or service
- Dig into logs — Confirm your hypothesis.
- Take action — Fix, isolate, or escalate.
- Write a post-mortem — Every time. No exceptions.
In high-scale environments, we always collect system state data BEFORE making changes. Run uptime, free -m, df -h, and ps aux --sort=-%cpu | head as your first move. This data becomes critical for your post-mortem and protects you if something goes sideways during the fix.
CPU Issues: When the Box is Choking
High CPU is often the first symptom that shows up in monitoring, but it’s rarely the full story.
Step 1: Get the quick picture
command
uptime
# Output: 14:22:01 up 42 days, load average: 8.34, 7.21, 5.10
Load average is your first signal. On a 4-core machine, a load of 8+ means processes are queuing. On a 32-core machine, that’s fine. Always divide by the number of cores. Anything above 1.0 per core deserves attention.
drill down with top
top -c -o %CPU
# Press 1 to see per-CPU breakdown
# Press M to sort by memory instead
The -c flag shows the full command — this is crucial because a generic java process tells you nothing, but java -jar /opt/myapp/app.jar tells you exactly what’s running.
Step 2: Check if it’s user space or kernel
vmstat gives you the full picture.
vmstat 2 5
# Run 5 snapshots, 2 seconds apart
# us = user CPU, sy = system/kernel CPU, wa = I/O wait
High sy (system CPU) often points to kernel-level issues — excessive system calls, context switching, or network interrupts. High wa (I/O wait) means your CPU is literally sitting idle waiting for disk or network. These are completely different problems with different fixes.
From my experience: One of the most overlooked causes of CPU spikes in production is zombie processes — processes that have died but whose parent hasn’t cleaned them up. Run ps aux | awk '$8=="Z"' to spot them. They don’t use CPU themselves, but thousands of them can exhaust the process table and prevent new processes from spawning.
Step 3: Find the exact thread/process causing the spike
for java/jvm services specifically
top -H -p <PID>        # Shows threads of a specific process.
ps -eLf | grep <PID>   # All threads with LWP IDs
In Java applications, correlate the top thread LWP ID (convert to hex) with jstack <PID> output to find the exact code path consuming CPU.
Memory Issues: Leaks, Swapping, and OOM Kills
The quick check
command
free -mh
# -m for megabytes, -h for human readable

              total        used        free      shared  buff/cache   available
Mem:           31Gi        18Gi       1.2Gi       421Mi        11Gi        12Gi
The available column is what actually matters — not free. Linux uses free memory for disk cache (which is healthy), so free often looks low even on healthy systems. If available is critically low, you have a real problem.
Is the OOM killer firing?
check kernel logs for OOM events
dmesg -T | grep -i "killed process\|oom\|out of memory"
journalctl -k | grep -i oom
OOM kills in production are brutal — they kill the highest-scoring process, which may not be the one causing the leak. Always check if your application was the victim or the cause.
Diagnose swap usage
per-process swap usage — often missing from generic guides
for pid in /proc/[0-9]*; do
  proc=$(cat $pid/comm 2>/dev/null)
  swap=$(awk '/VmSwap/{print $2}' $pid/status 2>/dev/null)
  [ -n "$swap" ] && [ "$swap" -gt 0 ] && echo "$swap KB - $proc (PID: ${pid##*/})"
done | sort -rn | head -20
disk space
df -i | grep -v tmpfsfind the directory eating space
du -sh /* 2>/dev/null | sort -rh | head -15
du -sh /var/* 2>/dev/null | sort -rh | head -10
In a real incident at a previous role, a server had 80% free disk space but services were failing. The culprit? Inode exhaustion caused by a logging service creating millions of tiny temp files in /tmp. df -h showed space available; df -i showed 100% inodes used. Always check both.
Diagnosing disk I/O bottlenecks for linux troubleshooting
iostat — the gold standard
iostat -xz 2 5
# Key columns: %util (device utilization), await (avg wait time ms), r/s, w/s
If %util is consistently above 80%, your disk is saturated. The await column tells you how long I/O requests are waiting — high await with low %util often points to slow disks or network-attached storage (NAS/EBS) latency rather than throughput saturation.
which process is hammering the disk?
iotop -oPa       # -o shows only active processes, -P shows processes not threads
# or with pidstat:
pidstat -d 2 5
Network Troubleshooting: From Connectivity to Saturation
Layer by layer: don’t skip steps
basic connectivity
ping -c 5 8.8.8.8          # Tests basic IP routing
traceroute -n 8.8.8.8      # Where are packets dropping?
mtr --report 8.8.8.8       # Better than traceroute for packet loss
dns resolution issues
dig +short google.com @8.8.8.8    # Query external DNS
dig +short google.com              # Query your configured resolver
cat /etc/resolv.conf               # What resolver is configured?
Socket and connection state analysis
use ss instead of netstat — it’s faster and more informative
ss -tulnp              # All listening TCP/UDP ports with process info
ss -s                  # Summary: established, time-wait, etc.
ss -tn state TIME-WAIT | wc -l   # Count TIME_WAIT connections
A massive number of TIME_WAIT connections is a common issue in high-traffic services. It usually means short-lived connections without keep-alive. The fix is usually net.ipv4.tcp_fin_timeout tuning or enabling HTTP keep-alive in your load balancer — not killing connections.
test HTTP(s) end-to-end with timing
curl -o /dev/null -s -w "\
  DNS: %{time_namelookup}s\n\
  Connect: %{time_connect}s\n\
  TLS: %{time_appconnect}s\n\
  TTFB: %{time_starttransfer}s\n\
  Total: %{time_total}s\n\
  HTTP: %{http_code}\n" https://yourservice.internal/health
This single curl command has saved me hours in debugging. It tells you exactly where time is being spent — DNS, TCP handshake, TLS, or application processing. TTFB (Time to First Byte) minus TLS time is your pure application latency.
Packet-level debugging
tcpdump — use with caution on production
tcpdump -i eth0 -n 'port 443' -c 1000 -w /tmp/capture.pcap
# Write to file, analyze with Wireshark offline
# Never run verbose tcpdump without -c or -w on prod — it will impact performance
Never run tcpdump in verbose mode on a production server without limiting output with -c (packet count) or -w (write to file). I’ve seen careless use of tcpdump increase CPU by 40% on high-throughput servers. Capture to a file, analyze offline.
Service and Process Debugging
Systemd services
service status and recent logs
systemctl status nginx -l     # -l for full log lines, no truncation
journalctl -u nginx -n 100 --no-pager
journalctl -u nginx --since "10 minutes ago"
journalctl -u nginx -f        # Follow, like tail -f
check if a service is cycling (crash-restart loop)
systemctl show nginx --property=NRestarts
# Also check:
journalctl -u nginx | grep -i "started\|stopped\|failed" | tail -30
Process management
find processes by name, port, or file
pgrep -la nginx               # All nginx processes with args
lsof -i :8080                 # What's listening on port 8080?
fuser 8080/tcp                # Simpler version
lsof -p <PID> | grep -i del  # Files deleted but still held open (causing disk space issues)
Be careful with kill -9. SIGKILL doesn’t allow a process to clean up — it can leave behind locked files, incomplete transactions, and corrupted state. Always try kill -15 (SIGTERM) first and give the process 5-10 seconds to shut down gracefully. Only escalate to kill -9 if the process doesn’t respond to SIGTERM. In databases and message queues, a forced kill can cause data loss or require manual recovery.
Log Analysis: Finding Signal in the Noise
Logs are the ground truth. Every other metric is a derivative — logs tell you exactly what happened and when.
Essential log locations
/var/log/syslogor/var/log/messages— System events/var/log/kern.log— Kernel messages (OOM, hardware errors)/var/log/auth.log— Authentication events, SSH activity/var/log/nginx/error.log— Web server errorsjournalctl— Systemd journal (often the primary log source now)
Power commands for log analysis
count errors by minute to spot the spike
grep "ERROR" /var/log/app.log | \
  awk '{print $1, $2}' | \
  cut -c1-16 | \
  sort | uniq -c | sort -rn | head -20
extract unique error messages (ignore timestamps/IDs)
grep "ERROR" /var/log/app.log | \
  sed 's/[0-9a-f-]\{8\}-[0-9a-f-]\{4\}-[0-9a-f-]\{4\}-[0-9a-f-]\{4\}-[0-9a-f-]\{12\}//g' | \
  sed 's/[0-9]\{4\}-[0-9]\{2\}-[0-9]\{2\}T[0-9:.]*Z//g' | \
  sort | uniq -c | sort -rn | head -20
watch logs in real-time with highlighting
tail -f /var/log/nginx/error.log | grep --color=always -E "error|crit|alert"When dealing with high-volume logs, use grep -c to count matches before displaying them. Opening a 10GB log file with cat or even tail on a production server under load can spike I/O. Always use grep, awk, or sed to filter first.
File System and Permission Issues
Common file permission problems
find files owned by a user or with specific permissions
find /var/www -name "*.php" -perm -o+w    # World-writable PHP files (security risk)
find /etc -type f -perm /4000              # Setuid files
find /tmp -mmin -60 -type f                # Files modified in last 60 min
check what a process can actually access
ls -la /proc/<PID>/fd | head -20     # Open file descriptors
cat /proc/<PID>/limits               # Process resource limits
cat /proc/<PID>/status               # UID, GID, memory info
SELinux and AppArmor blocking silently
check for security module denials
# SELinux:
ausearch -m avc -ts recent
sealert -a /var/log/audit/audit.log

# AppArmor:
dmesg | grep apparmor
aa-status
This is one of the most frustrating root causes to find when you’re new to a system. The service is running, permissions look correct, but nothing works — because SELinux is silently denying access. Always check audit logs before assuming the application is broken.
Real Production Incidents: What I’ve Actually Seen
Incident #1: The 3 AM “Disk Full” That Wasn’t
Alerts fired for a web server returning 500s. First check: df -h showed 60% disk usage. Clean. But errors continued. Second check: df -i — 100% inode usage. A misconfigured logrotate was creating new files instead of rotating them, generating tens of thousands of tiny files per hour in /var/log. The fix was deleting old log fragments and fixing the logrotate config, but the real lesson: always check inodes. Disk space alerts don’t catch this.
Incident #2: The Cascade That Started With a Slow DNS
A microservices deployment started timing out. CPU was fine, memory was fine, the code hadn’t changed. Running curl -w timing output against internal service endpoints showed DNS resolution taking 800ms — 40x normal. A DNS server change during infrastructure work had pointed services at an overloaded resolver. The internal service calls were all timing out waiting for DNS. Five minutes after rolling back the DNS config change, all timeouts disappeared. Network troubleshooting always starts at Layer 3.
Incident #3: The Process That Wouldn’t Die
A data pipeline service stopped processing but showed as “running” in systemd. No new jobs were completing. strace -p <PID> revealed the process was stuck in an uninterruptible sleep (D state) waiting on an NFS mount that had become unresponsive. Neither SIGTERM nor SIGKILL would free it — the kernel was blocking on the I/O operation. The only fix was to remount the NFS share (after verifying the remote server was alive). This is why we never put application state on NFS without timeout configurations.
Performance Bottleneck Diagnosis: The Systematic Approach
Brendan Gregg’s USE Method (Utilization, Saturation, Errors) is how I approach any performance issue in production:
- Utilization — How busy is the resource (CPU:
mpstat, disk:iostat %util, network:sar -n DEV) - Saturation — Is there queuing? (CPU:
vmstat r column, disk:iostat avgqu-sz) - Errors — Any hard failures? (
dmesg,/proc/net/devfor network errors)
one-liner system snapshot for your runbook
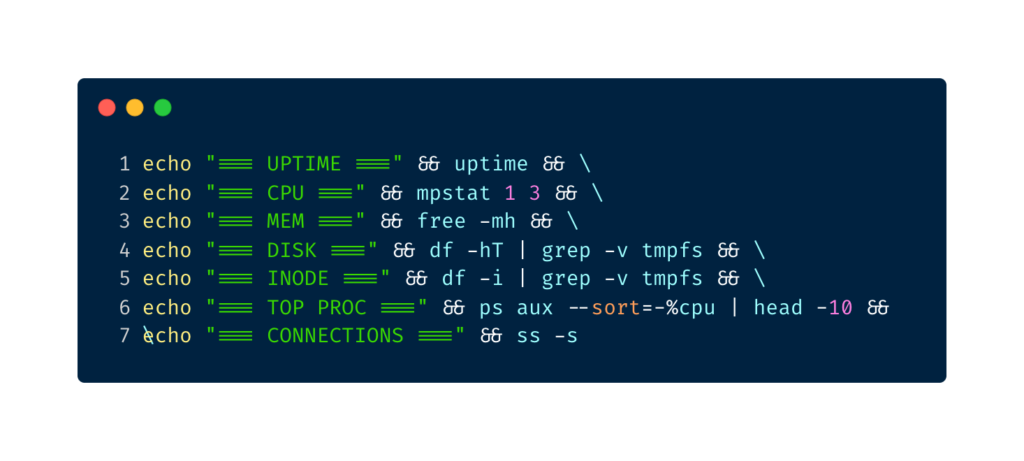
echo "=== UPTIME ===" && uptime && \
echo "=== CPU ===" && mpstat 1 3 && \
echo "=== MEM ===" && free -mh && \
echo "=== DISK ===" && df -hT | grep -v tmpfs && \
echo "=== INODE ===" && df -i | grep -v tmpfs && \
echo "=== TOP PROC ===" && ps aux --sort=-%cpu | head -10 && \
echo "=== CONNECTIONS ===" && ss -s
I have this saved as an alias — syscheck — on every server I manage. Run it the moment you SSH in during an incident. It gives you the full picture in under 10 seconds and provides a snapshot you can paste into your incident channel.
Pro Tips From the Trenches for linux troubleshooting
- Script your runbooks. Every troubleshooting sequence you run more than once should be a shell script. Keep them in a shared Git repo the whole team can access.
- Never trust a metric in isolation. High CPU + high load average means you’re busy. High CPU + low load average might mean a single-threaded process is spinning. Context matters.
- Use
stracesparingly. It’s powerful but adds overhead — attachingstraceto a busy process can slow it by 5-10x. Use-f -e trace=file,networkto filter only what you need, and always set a count limit. - Preserve evidence before you fix. Run
ps aux > /tmp/ps-incident.txt,netstat -an > /tmp/netstat-incident.txtbefore restarting anything. You’ll need this for your post-mortem. - Know your baseline. You can’t know if something is abnormal if you don’t know what normal looks like. Set up continuous collection of
vmstat,iostat, andss -sinto a time-series database (Prometheus + node_exporter handles this well). - When in doubt, check
dmesg. Hardware errors, kernel panics, OOM kills, NFS timeouts — they all show up indmesg. It’s the first place I check in any incident that doesn’t have an obvious application-level cause.
Conclusion: Build the Habit Before the Incident
Linux troubleshooting isn’t about memorizing commands. It’s about building a mental model of how the system works so that when something breaks, you know where to look. CPU, memory, disk, network — these are the four physical constraints every Linux system operates under. Every production incident maps to one or more of these.
The engineers I’ve seen handle incidents best aren’t the ones who know the most obscure commands. They’re the ones who stay calm, work systematically, and document everything. They’ve built runbooks, they’ve run fire drills, and they’ve done proper post-mortems instead of declaring victory the moment service is restored.
Start building that habit now. Set up your syscheck alias. Write your first runbook this week. And the next time your phone goes off at 2:47 AM, you’ll know exactly what to do first.
Quick reference card: CPU → top -c -o %CPU, vmstat 2 5 | Memory → free -mh, dmesg | grep oom | Disk → df -hT, df -i, iostat -xz 2 | Network → ss -tulnp, ss -s, curl -w timing | Services → systemctl status, journalctl -u <service> | Processes → ps aux --sort=-%cpu, lsof -p <PID>
You can also read more troubleshooting guides.
Pratik Shinde
Pratik Shinde is a DevOps and Cloud professional based in Pune, Maharashtra, India, with hands-on experience in building and managing scalable systems. Working in top multinational Organization as Devops Engineer with experience of 10+ years. He has a strong working background in DevOps, Kubernetes, and cloud platforms, along with practical exposure to artificial intelligence and machine learning concepts. He also shares knowledge and learning resources on platforms like LinkedIn and other social channels, aiming to simplify complex topics and make them accessible to a wider audience. Linkedin URL: https://www.linkedin.com/in/pratikshinde8494/ . Github URL: https://github.com/PratikShindeGithub